|
Download Data (XLS File) |
|
||||||||
|
||||||||
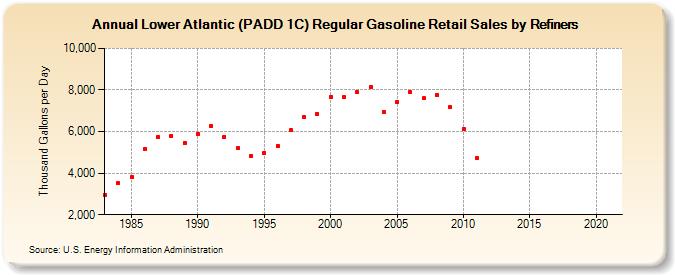
| Lower Atlantic (PADD 1C) Regular Gasoline Retail Sales by Refiners (Thousand Gallons per Day) | ||||||||
| Decade | Year-0 | Year-1 | Year-2 | Year-3 | Year-4 | Year-5 | Year-6 | Year-7 | Year-8 | Year-9 |
|---|---|---|---|---|---|---|---|---|---|---|
| 1980's | 2,960.3 | 3,510.0 | 3,802.6 | 5,149.3 | 5,743.2 | 5,803.0 | 5,460.6 | |||
| 1990's | 5,899.9 | 6,247.0 | 5,752.9 | 5,207.2 | 4,834.9 | 4,977.1 | 5,324.7 | 6,059.0 | 6,677.7 | 6,853.3 |
| 2000's | 7,674.4 | 7,651.1 | 7,883.9 | 8,150.4 | 6,955.7 | 7,438.6 | 7,879.4 | 7,599.6 | 7,778.6 | 7,168.7 |
| 2010's | 6,127.3 | 4,712.8 | W | W | W | W | W | W | W | W |
| 2020's | W |
| - = No Data Reported; -- = Not Applicable; NA = Not Available; W = Withheld to avoid disclosure of individual company data. |
| Release Date: 6/1/2022 |
| Next Release Date: TBD |