|
Download Data (XLS File) |
|
||||||||
|
||||||||
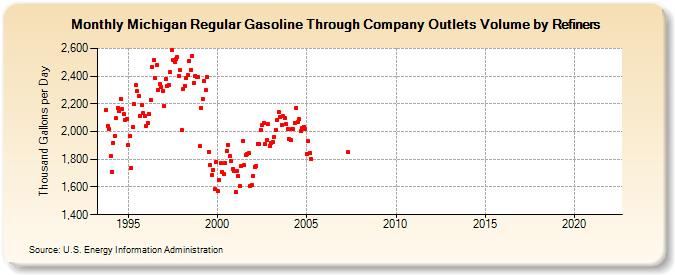
| Michigan Regular Gasoline Through Company Outlets Volume by Refiners (Thousand Gallons per Day) | ||||||||
| Year | Jan | Feb | Mar | Apr | May | Jun | Jul | Aug | Sep | Oct | Nov | Dec |
|---|---|---|---|---|---|---|---|---|---|---|---|---|
| 1993 | 2,156.7 | 2,042.0 | 2,018.9 | |||||||||
| 1994 | 1,820.1 | 1,709.3 | 1,919.8 | 1,967.1 | 2,095.0 | 2,169.8 | 2,147.5 | 2,237.0 | 2,161.5 | 2,124.3 | 2,082.2 | 2,090.8 |
| 1995 | 1,902.4 | 1,966.4 | 1,740.2 | 2,034.4 | 2,196.1 | 2,333.8 | 2,294.1 | 2,259.2 | 2,114.0 | 2,190.7 | 2,132.0 | 2,112.8 |
| 1996 | 2,040.2 | 2,062.1 | 2,125.9 | 2,230.0 | 2,467.3 | 2,517.0 | 2,383.8 | 2,478.8 | 2,299.7 | 2,340.6 | 2,323.1 | 2,295.1 |
| 1997 | 2,181.4 | 2,379.8 | 2,329.4 | 2,337.0 | 2,428.3 | 2,587.1 | 2,514.5 | 2,502.0 | 2,521.7 | 2,537.4 | 2,399.2 | 2,441.1 |
| 1998 | 2,008.1 | 2,310.3 | 2,330.6 | 2,384.9 | 2,405.8 | 2,512.6 | 2,446.4 | 2,548.5 | 2,353.6 | 2,401.0 | 2,395.9 | 2,391.1 |
| 1999 | 1,893.0 | 2,169.7 | 2,236.7 | 2,361.5 | 2,300.2 | 2,390.4 | 1,854.4 | 1,757.2 | 1,686.1 | 1,723.4 | 1,583.1 | 1,780.0 |
| 2000 | 1,571.5 | 1,652.0 | 1,770.7 | 1,708.7 | 1,690.6 | 1,774.1 | 1,856.8 | 1,904.8 | 1,824.6 | 1,786.1 | 1,729.2 | 1,712.2 |
| 2001 | 1,560.8 | 1,716.1 | 1,677.5 | 1,605.8 | 1,750.4 | 1,934.1 | 1,755.3 | 1,832.5 | 1,835.0 | 1,843.9 | 1,606.7 | 1,613.3 |
| 2002 | 1,679.5 | 1,742.7 | 1,750.7 | 1,912.3 | 1,912.0 | 2,012.0 | 2,048.0 | 2,061.8 | 1,908.0 | 1,936.5 | 2,051.3 | 1,894.0 |
| 2003 | 1,914.2 | 1,925.2 | 1,961.3 | 2,011.2 | 2,084.1 | 2,137.6 | 2,105.4 | 2,047.4 | 2,109.7 | 2,098.3 | 2,053.1 | 2,018.7 |
| 2004 | 1,946.1 | 1,936.6 | 2,016.9 | 2,017.3 | 2,062.6 | 2,173.1 | 2,068.8 | 2,088.7 | 2,003.2 | 2,024.6 | 2,035.8 | 2,018.8 |
| 2005 | 1,841.1 | 1,929.7 | 1,846.5 | 1,804.0 | W | W | W | W | W | W | W | W |
| 2006 | W | W | W | W | W | W | W | W | W | W | W | W |
| 2007 | W | W | W | W | 1,850.6 | W | W | W | W | W | W | W |
| 2008 | W | W | W | W | W | W | W | W | W | W | W | W |
| 2009 | W | W | W | W | W | W | W | W | W | W | W | W |
| 2010 | W | W | W | W | W | W | W | W | W | W | W | W |
| 2011 | W | W | W | W | W | W | W | W | W | W | W | W |
| 2012 | W | W | W | W | W | W | W | W | W | W | W | W |
| 2013 | W | W | W | W | W | W | W | W | W | W | W | W |
| 2014 | W | W | W | W | W | W | W | W | W | W | W | W |
| 2015 | W | W | W | W | W | W | W | W | W | W | W | W |
| 2016 | W | W | W | W | W | W | W | W | W | W | W | W |
| 2017 | W | W | W | W | W | W | W | W | W | W | W | W |
| 2018 | W | W | W | W | W | W | W | W | W | W | W | W |
| 2019 | W | W | W | W | W | W | W | W | W | W | W | W |
| 2020 | W | W | W | W | W | W | W | W | W | W | W | W |
| 2021 | W | W | W | W | W | - | - | - | - | - | - | - |
| 2022 | - | - | - | |||||||||
| - = No Data Reported; -- = Not Applicable; NA = Not Available; W = Withheld to avoid disclosure of individual company data. |
| Release Date: 6/1/2022 |
| Next Release Date: TBD |