|
Download Data (XLS File) |
|
||||||||
|
||||||||
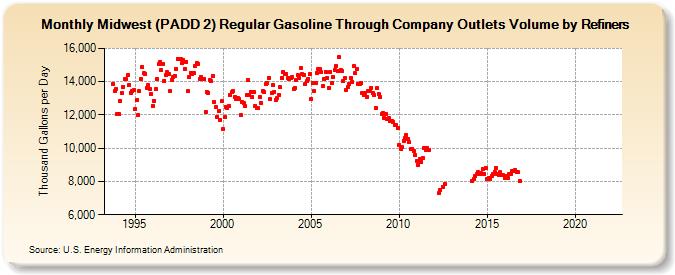
| Midwest (PADD 2) Regular Gasoline Through Company Outlets Volume by Refiners (Thousand Gallons per Day) | ||||||||
| Year | Jan | Feb | Mar | Apr | May | Jun | Jul | Aug | Sep | Oct | Nov | Dec |
|---|---|---|---|---|---|---|---|---|---|---|---|---|
| 1993 | 13,886.0 | 13,436.6 | 13,555.3 | |||||||||
| 1994 | 12,042.5 | 12,038.6 | 12,857.2 | 13,329.6 | 13,701.4 | 14,159.1 | 14,165.1 | 14,386.8 | 13,800.0 | 13,342.2 | 13,418.5 | 13,475.5 |
| 1995 | 12,333.0 | 12,885.0 | 11,966.8 | 13,423.8 | 14,160.8 | 14,891.4 | 14,517.7 | 14,475.5 | 13,634.6 | 13,800.0 | 13,549.6 | 13,266.3 |
| 1996 | 12,561.9 | 12,857.8 | 13,549.5 | 14,163.6 | 15,042.3 | 15,185.2 | 14,682.4 | 15,046.5 | 14,067.1 | 14,405.8 | 14,561.5 | 14,463.5 |
| 1997 | 13,412.6 | 14,096.5 | 14,269.6 | 14,369.0 | 14,753.9 | 15,364.3 | 15,353.3 | 15,357.7 | 15,092.8 | 15,295.7 | 14,775.5 | 15,201.6 |
| 1998 | 13,409.4 | 14,284.5 | 14,536.7 | 14,444.5 | 14,544.5 | 14,935.4 | 15,136.0 | 15,088.7 | 14,174.1 | 14,288.9 | 14,159.2 | 14,189.5 |
| 1999 | 12,192.8 | 13,386.9 | 13,336.1 | 14,097.6 | 14,017.4 | 14,368.4 | 12,804.5 | 12,458.1 | 11,892.6 | 12,227.6 | 11,696.0 | 12,812.4 |
| 2000 | 11,146.2 | 11,855.1 | 12,498.4 | 12,442.8 | 12,513.2 | 13,220.5 | 13,376.2 | 13,434.0 | 13,098.4 | 12,942.2 | 13,031.6 | 12,930.3 |
| 2001 | 11,975.6 | 12,806.3 | 12,694.2 | 12,541.8 | 13,208.6 | 14,075.8 | 13,181.4 | 13,397.0 | 13,047.6 | 13,364.0 | 12,553.2 | 12,426.8 |
| 2002 | 12,398.6 | 13,072.9 | 12,730.3 | 13,429.5 | 13,387.3 | 13,829.9 | 13,909.8 | 14,223.5 | 12,951.1 | 13,295.7 | 13,807.9 | 13,406.9 |
| 2003 | 12,916.1 | 13,018.7 | 13,207.6 | 13,648.9 | 14,221.3 | 14,603.8 | 14,469.6 | 14,472.4 | 14,211.2 | 14,179.6 | 14,218.4 | 14,263.7 |
| 2004 | 13,539.9 | 13,620.3 | 14,102.7 | 14,370.1 | 14,229.4 | 14,823.2 | 14,451.2 | 14,402.3 | 13,833.0 | 14,032.9 | 14,189.6 | 14,449.9 |
| 2005 | 12,934.0 | 13,901.1 | 13,459.3 | 13,908.9 | 14,521.7 | 14,777.7 | 14,732.9 | 14,562.0 | 13,759.1 | 14,142.5 | 14,597.2 | 14,228.8 |
| 2006 | 13,639.0 | 14,605.4 | 13,917.5 | 14,274.8 | 14,700.5 | 14,928.7 | 14,658.0 | 15,454.2 | 14,689.0 | 14,616.0 | 14,051.5 | 14,197.3 |
| 2007 | 13,517.1 | 13,656.0 | 13,834.9 | 14,222.5 | 13,965.6 | 14,928.7 | 14,503.4 | 14,749.7 | 13,884.2 | 13,849.8 | 13,933.3 | 13,297.6 |
| 2008 | 13,222.6 | 13,333.6 | 13,107.1 | 13,425.8 | 13,457.3 | 13,622.6 | 13,333.3 | 13,188.9 | 12,418.0 | 13,608.4 | 13,247.8 | 13,092.3 |
| 2009 | 12,035.0 | 12,145.1 | 11,839.3 | 12,050.3 | 11,730.6 | 11,820.5 | 11,612.7 | 11,656.6 | 11,587.4 | 11,374.6 | 11,376.5 | 11,219.5 |
| 2010 | 10,180.0 | 9,966.8 | 10,070.2 | 10,449.9 | 10,622.8 | 10,787.5 | 10,570.1 | 10,354.5 | 9,965.2 | 9,936.4 | 9,801.9 | 9,577.9 |
| 2011 | 9,230.6 | 9,014.4 | 9,354.5 | 9,180.7 | 9,419.8 | 10,020.2 | 9,919.5 | 9,998.0 | 9,898.8 | W | W | W |
| 2012 | W | W | W | 7,293.7 | 7,466.6 | W | 7,683.9 | 7,817.0 | W | W | W | W |
| 2013 | W | W | W | W | W | W | W | W | W | W | W | W |
| 2014 | W | W | 8,025.0 | 8,145.1 | 8,320.0 | 8,432.2 | 8,540.1 | 8,450.8 | 8,489.2 | 8,758.8 | 8,457.8 | 8,800.1 |
| 2015 | 8,127.7 | 8,233.3 | 8,164.1 | 8,333.1 | 8,463.2 | 8,580.4 | 8,812.0 | 8,458.9 | 8,416.3 | 8,552.5 | 8,389.5 | 8,366.8 |
| 2016 | 8,216.4 | 8,339.0 | 8,222.9 | 8,463.7 | 8,474.9 | 8,633.6 | 8,608.1 | 8,666.7 | 8,589.8 | 8,540.7 | 8,030.7 | W |
| 2017 | W | W | W | W | W | W | W | W | W | W | W | W |
| 2018 | W | W | W | W | W | W | W | W | W | W | W | W |
| 2019 | W | W | W | W | W | W | W | W | W | W | W | W |
| 2020 | W | W | W | W | W | W | W | W | W | W | W | W |
| 2021 | W | W | W | W | W | W | W | W | W | W | W | W |
| 2022 | W | W | W | |||||||||
| - = No Data Reported; -- = Not Applicable; NA = Not Available; W = Withheld to avoid disclosure of individual company data. |
| Release Date: 6/1/2022 |
| Next Release Date: TBD |