|
Download Data (XLS File) |
|
||||||||
|
||||||||
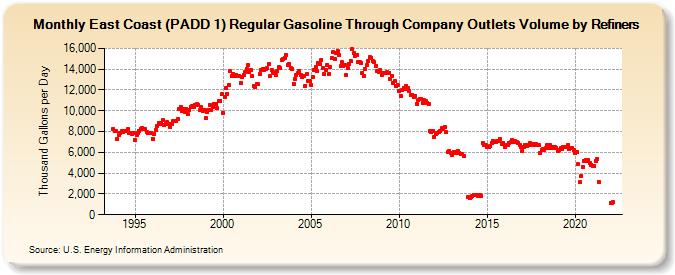
| East Coast (PADD 1) Regular Gasoline Through Company Outlets Volume by Refiners (Thousand Gallons per Day) | ||||||||
| Year | Jan | Feb | Mar | Apr | May | Jun | Jul | Aug | Sep | Oct | Nov | Dec |
|---|---|---|---|---|---|---|---|---|---|---|---|---|
| 1993 | 8,246.9 | 8,068.2 | 8,021.4 | |||||||||
| 1994 | 7,251.6 | 7,691.5 | 7,871.5 | 8,019.6 | 7,934.9 | 8,045.9 | 8,065.6 | 8,232.4 | 7,816.1 | 7,827.2 | 7,721.3 | 7,831.0 |
| 1995 | 7,184.5 | 7,704.6 | 7,874.1 | 8,073.5 | 8,269.9 | 8,379.2 | 8,224.7 | 8,258.1 | 7,958.5 | 7,874.3 | 7,865.4 | 7,862.8 |
| 1996 | 7,288.2 | 7,757.8 | 8,182.2 | 8,579.2 | 8,841.5 | 8,718.5 | 8,813.8 | 9,110.9 | 8,593.5 | 8,768.8 | 8,877.7 | 8,744.3 |
| 1997 | 8,441.1 | 8,732.3 | 8,977.6 | 8,998.0 | 9,018.8 | 9,165.5 | 10,191.0 | 10,407.3 | 9,947.9 | 10,152.6 | 9,928.9 | 10,152.8 |
| 1998 | 9,657.1 | 10,073.4 | 10,403.5 | 10,429.4 | 10,400.2 | 10,592.1 | 10,666.3 | 10,582.3 | 10,048.9 | 10,320.2 | 10,009.9 | 10,098.4 |
| 1999 | 9,305.3 | 9,910.5 | 10,120.2 | 10,588.5 | 10,102.3 | 10,372.8 | 10,697.2 | 10,688.9 | 10,264.6 | 10,910.4 | 10,939.2 | 11,566.0 |
| 2000 | 9,808.7 | 11,283.8 | 12,195.8 | 11,649.3 | 12,443.5 | 13,788.8 | 13,384.2 | 13,538.8 | 13,327.3 | 13,427.9 | 13,345.5 | 13,342.1 |
| 2001 | 12,641.8 | 13,212.4 | 13,451.3 | 13,750.6 | 14,024.4 | 14,379.1 | 13,752.8 | 13,908.8 | 13,323.8 | 12,418.2 | 12,303.5 | 12,583.0 |
| 2002 | 12,539.4 | 13,500.5 | 13,888.9 | 13,984.4 | 13,960.4 | 14,031.6 | 14,076.1 | 14,479.8 | 13,352.2 | 13,960.7 | 13,685.4 | 13,632.4 |
| 2003 | 13,402.6 | 13,822.6 | 14,175.0 | 14,066.7 | 14,897.7 | 14,969.0 | 15,120.5 | 15,408.8 | 14,411.8 | 14,536.2 | 14,131.7 | 14,038.1 |
| 2004 | 12,600.8 | 13,059.2 | 13,405.7 | 13,624.8 | 13,825.0 | 13,429.7 | 13,216.5 | 13,328.6 | 12,406.6 | 13,503.5 | 12,904.8 | 12,886.9 |
| 2005 | 12,465.2 | 13,240.2 | 13,946.0 | 14,250.8 | 13,784.7 | 14,546.7 | 14,523.5 | 14,868.0 | 14,137.2 | 13,501.8 | 13,904.5 | 14,398.4 |
| 2006 | 13,540.6 | 14,221.3 | 15,111.0 | 15,635.1 | 15,027.1 | 15,553.0 | 15,759.2 | 15,330.8 | 14,262.2 | 14,646.4 | 14,304.9 | 14,372.9 |
| 2007 | 13,438.8 | 14,109.4 | 14,502.3 | 14,802.3 | 15,938.0 | 15,511.0 | 15,295.9 | 15,406.5 | 14,676.1 | 14,718.0 | 14,549.0 | 13,630.0 |
| 2008 | 13,323.6 | 13,999.0 | 14,379.1 | 14,765.1 | 15,169.8 | 15,101.3 | 14,741.7 | 14,655.1 | 14,304.1 | 13,838.1 | 13,720.4 | 13,886.2 |
| 2009 | 13,411.5 | 13,657.7 | 13,657.4 | 13,585.0 | 13,703.0 | 13,641.0 | 13,088.8 | 13,297.4 | 12,714.7 | 12,826.9 | 12,398.7 | 12,489.0 |
| 2010 | 11,863.6 | 11,467.3 | 11,980.8 | 12,228.2 | 12,087.9 | 12,426.8 | 12,142.0 | 11,878.7 | 11,510.6 | 11,544.1 | 11,349.8 | 11,445.6 |
| 2011 | 10,686.6 | 10,996.4 | 11,134.6 | 11,103.7 | 10,774.4 | 10,991.7 | 10,984.0 | 10,760.9 | 10,612.5 | 8,071.0 | 7,925.0 | 8,053.2 |
| 2012 | 7,430.3 | 7,760.6 | 7,891.1 | 7,913.7 | 8,055.8 | 8,335.8 | 8,257.8 | 8,440.7 | 7,925.3 | 6,026.5 | 6,135.1 | 5,909.8 |
| 2013 | 5,743.8 | 6,032.4 | 5,986.0 | 5,965.8 | 6,119.8 | 5,965.6 | 5,844.1 | 5,860.5 | 5,611.2 | NA | NA | 1,664.2 |
| 2014 | 1,608.5 | 1,703.8 | 1,823.0 | 1,852.4 | 1,872.5 | 1,884.0 | 1,847.3 | 1,852.8 | 1,805.4 | 6,885.1 | 6,728.8 | 6,668.6 |
| 2015 | 6,503.3 | 6,508.9 | 6,629.2 | 6,884.3 | 7,105.2 | 6,963.2 | 7,010.4 | 7,072.5 | 7,076.0 | 7,270.4 | 6,792.9 | 6,906.6 |
| 2016 | 6,525.1 | 6,659.3 | 6,693.1 | 6,906.3 | 6,951.5 | 7,206.4 | 7,023.8 | 7,048.2 | 7,027.2 | 6,929.0 | 6,723.4 | 6,560.6 |
| 2017 | 6,153.0 | 6,536.0 | 6,665.3 | 6,617.2 | 6,717.9 | 6,917.2 | 6,718.8 | 6,812.0 | 6,666.2 | 6,813.1 | 6,676.4 | 6,668.0 |
| 2018 | 5,950.5 | 6,205.3 | 6,321.4 | 6,268.8 | 6,391.3 | 6,671.9 | 6,455.1 | 6,660.1 | 6,376.7 | 6,553.6 | 6,545.3 | 6,394.0 |
| 2019 | 6,177.1 | 6,212.1 | 6,387.8 | 6,348.0 | 6,559.0 | 6,527.2 | 6,538.3 | 6,743.6 | 6,337.2 | 6,425.6 | 6,406.7 | 6,182.7 |
| 2020 | 5,934.6 | 6,022.2 | 4,842.3 | 3,099.0 | 3,705.5 | 4,633.8 | 5,202.2 | 5,265.1 | 5,150.5 | 5,245.1 | 4,952.7 | 4,822.1 |
| 2021 | 4,660.5 | 4,665.8 | 5,168.3 | 5,374.0 | 3,172.6 | W | W | W | W | W | W | W |
| 2022 | 1,126.9 | 1,166.9 | 1,175.3 | |||||||||
| - = No Data Reported; -- = Not Applicable; NA = Not Available; W = Withheld to avoid disclosure of individual company data. |
| Release Date: 6/1/2022 |
| Next Release Date: TBD |