|
Download Data (XLS File) |
|
||||||||
|
||||||||
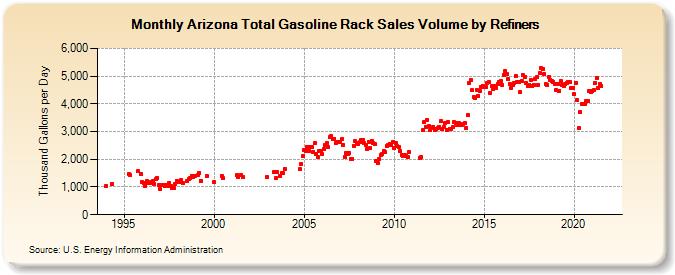
| Arizona Total Gasoline Rack Sales Volume by Refiners (Thousand Gallons per Day) | ||||||||
| Year | Jan | Feb | Mar | Apr | May | Jun | Jul | Aug | Sep | Oct | Nov | Dec |
|---|---|---|---|---|---|---|---|---|---|---|---|---|
| 1994 | 1,039.8 | W | W | W | 1,109.5 | W | W | W | W | W | W | W |
| 1995 | W | W | W | 1,474.6 | 1,423.7 | W | W | W | W | 1,559.0 | W | 1,473.8 |
| 1996 | 1,172.7 | 1,133.3 | 1,029.8 | 1,223.0 | 1,130.3 | 1,147.2 | 1,171.4 | 1,208.1 | 1,108.0 | 1,276.8 | 1,336.9 | 1,054.4 |
| 1997 | 933.9 | 1,065.5 | 1,063.6 | 1,039.9 | 1,081.4 | 1,053.4 | 1,141.1 | 1,035.2 | 960.2 | 975.3 | 1,126.0 | 1,214.0 |
| 1998 | 1,181.7 | 1,168.2 | 1,250.7 | 1,134.7 | W | W | 1,226.1 | 1,279.5 | 1,314.8 | 1,408.0 | 1,353.3 | 1,389.5 |
| 1999 | W | 1,415.3 | 1,515.3 | 1,224.1 | W | W | W | 1,382.3 | W | W | W | W |
| 2000 | 1,169.7 | W | W | W | W | 1,406.8 | 1,309.8 | W | W | W | W | W |
| 2001 | W | W | W | 1,418.6 | 1,355.5 | W | 1,435.3 | 1,377.7 | W | W | W | W |
| 2002 | W | W | W | W | W | W | W | W | W | W | W | 1,350.9 |
| 2003 | W | W | W | W | 1,528.6 | 1,309.2 | 1,529.9 | W | 1,409.5 | 1,506.4 | 1,495.7 | 1,659.3 |
| 2004 | W | W | W | W | W | W | W | W | W | 1,638.4 | 1,828.0 | 2,108.3 |
| 2005 | 2,326.3 | 2,296.7 | 2,444.5 | 2,311.0 | 2,438.6 | 2,431.3 | 2,262.7 | 2,569.5 | 2,183.5 | 2,073.5 | 2,311.6 | 2,291.4 |
| 2006 | 2,178.5 | 2,353.8 | 2,516.5 | 2,578.5 | 2,440.4 | 2,792.8 | 2,838.0 | 2,719.2 | 2,747.5 | 2,603.9 | 2,624.3 | 2,614.6 |
| 2007 | 2,632.9 | 2,719.8 | 2,526.9 | 2,078.3 | 2,233.3 | 2,202.6 | 2,228.1 | 1,996.6 | 2,016.7 | 2,495.1 | 2,646.2 | 2,593.1 |
| 2008 | 2,553.7 | 2,607.7 | 2,704.4 | 2,707.2 | 2,574.1 | 2,512.8 | 2,380.9 | 2,633.4 | 2,402.9 | 2,661.9 | 2,592.6 | 2,547.5 |
| 2009 | 1,952.8 | 1,857.8 | 2,005.6 | 2,155.4 | 2,187.2 | 2,306.4 | 2,246.3 | 2,479.7 | 2,510.3 | 2,562.3 | 2,512.1 | 2,616.1 |
| 2010 | 2,415.8 | 2,597.7 | 2,481.9 | 2,431.1 | 2,295.3 | 2,163.1 | 2,129.2 | 2,143.6 | 2,118.4 | 2,064.3 | 2,248.3 | W |
| 2011 | W | W | W | W | W | 2,051.9 | 2,066.6 | 3,042.9 | 3,326.7 | 3,170.6 | 3,418.3 | 3,186.7 |
| 2012 | 3,047.1 | 3,138.3 | 3,169.9 | 3,044.9 | 3,077.8 | 3,116.6 | 3,164.6 | 3,372.3 | 3,078.6 | 3,157.5 | 3,295.0 | 3,071.6 |
| 2013 | 3,336.0 | 3,101.4 | 3,109.5 | 3,149.2 | 3,339.3 | 3,292.3 | 3,232.6 | 3,316.2 | 3,240.6 | 3,250.4 | 3,276.4 | 3,310.2 |
| 2014 | 3,142.8 | 3,591.1 | 4,758.8 | 4,855.9 | 4,487.8 | 4,246.2 | 4,213.0 | 4,516.7 | 4,280.5 | 4,448.5 | 4,610.9 | 4,657.1 |
| 2015 | 4,593.7 | 4,622.9 | 4,767.3 | 4,783.1 | 4,401.2 | 4,636.5 | 4,526.5 | 4,659.7 | 4,581.2 | 4,719.3 | 4,793.5 | 4,819.5 |
| 2016 | 4,680.4 | 5,052.0 | 5,173.9 | 5,068.8 | 4,903.2 | 4,708.3 | 4,578.3 | 4,664.0 | 4,766.8 | 5,005.8 | 4,774.2 | 4,793.2 |
| 2017 | 4,413.7 | 4,829.3 | 5,037.0 | 4,980.1 | 4,758.5 | 4,641.7 | 4,689.7 | 4,864.8 | 4,637.2 | 4,686.7 | 4,901.2 | 4,953.7 |
| 2018 | 4,692.9 | 5,106.0 | 5,280.0 | 5,248.9 | 5,074.6 | 4,710.0 | 4,696.5 | 4,959.1 | 4,867.5 | 4,840.6 | 4,795.7 | 4,728.2 |
| 2019 | 4,498.9 | 4,706.3 | 4,477.2 | 4,812.2 | 4,688.5 | 4,634.5 | 4,704.6 | 4,764.7 | 4,793.6 | 4,781.4 | 4,560.3 | 4,568.5 |
| 2020 | 4,342.0 | 4,766.4 | 4,132.8 | 3,119.4 | 3,712.2 | 4,002.1 | 3,979.2 | 4,004.7 | 4,089.8 | 4,100.7 | 4,475.5 | 4,431.2 |
| 2021 | 4,445.8 | 4,502.9 | 4,758.8 | 4,925.7 | 4,579.9 | 4,714.8 | 4,656.1 | W | W | W | W | W |
| 2022 | W | W | W | |||||||||
| - = No Data Reported; -- = Not Applicable; NA = Not Available; W = Withheld to avoid disclosure of individual company data. |
| Release Date: 6/1/2022 |
| Next Release Date: TBD |