|
Download Data (XLS File) |
|
||||||||
|
||||||||
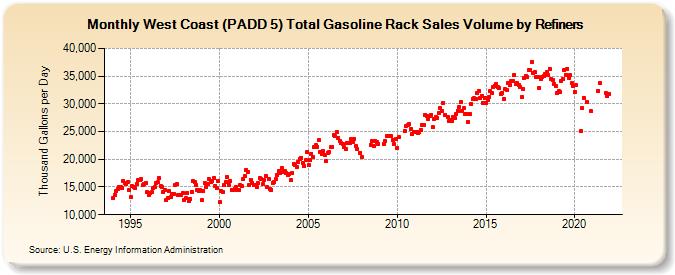
| West Coast (PADD 5) Total Gasoline Rack Sales Volume by Refiners (Thousand Gallons per Day) | ||||||||
| Year | Jan | Feb | Mar | Apr | May | Jun | Jul | Aug | Sep | Oct | Nov | Dec |
|---|---|---|---|---|---|---|---|---|---|---|---|---|
| 1994 | 13,045.8 | 13,536.5 | 14,312.7 | 14,612.7 | 15,004.2 | 15,020.2 | 14,893.4 | 16,052.2 | 15,767.2 | 15,617.3 | 15,987.7 | 14,381.1 |
| 1995 | 13,136.9 | 15,099.5 | 14,975.0 | 14,767.2 | 15,604.7 | 16,217.1 | 16,248.5 | 16,417.8 | 15,287.9 | 15,492.1 | 15,776.8 | 14,037.7 |
| 1996 | 13,583.3 | 13,836.0 | 14,015.4 | 14,805.5 | 14,909.5 | 15,661.0 | 15,835.5 | 16,602.3 | 15,201.6 | 15,087.5 | 14,151.2 | 14,527.1 |
| 1997 | 12,630.5 | 13,012.4 | 14,188.4 | 13,209.6 | 13,776.5 | 13,810.3 | 15,440.7 | 15,463.7 | 13,589.7 | 13,467.6 | 13,576.9 | 13,911.7 |
| 1998 | 12,686.2 | 12,955.2 | 13,878.5 | 12,434.0 | 12,808.6 | 14,139.0 | 16,065.7 | 15,886.6 | 15,395.2 | 14,378.2 | 14,226.1 | 14,442.0 |
| 1999 | 12,689.5 | 14,290.2 | 15,793.5 | 14,910.5 | 15,561.1 | 16,377.1 | 15,842.1 | 15,997.9 | 16,583.1 | 15,221.3 | 14,792.7 | 16,104.3 |
| 2000 | 12,289.8 | 14,356.9 | 14,163.8 | 15,339.6 | 15,869.9 | 16,758.2 | 15,443.4 | 16,045.8 | 14,530.2 | 14,517.0 | 14,626.9 | 15,053.5 |
| 2001 | 14,434.7 | 14,539.6 | 15,346.5 | 15,090.4 | 16,438.5 | 16,961.8 | 18,135.1 | 17,711.6 | 15,378.3 | 16,258.6 | 15,800.0 | 15,307.8 |
| 2002 | 15,326.1 | 15,013.3 | 15,632.0 | 16,583.1 | 16,419.8 | 15,499.0 | 16,249.3 | 17,019.6 | 14,984.5 | 16,501.3 | 14,697.1 | 14,537.9 |
| 2003 | 15,776.0 | 15,834.4 | 16,352.5 | 17,159.9 | 17,823.3 | 17,561.8 | 18,441.8 | 17,716.1 | 17,902.5 | 17,596.6 | 17,074.8 | 17,362.1 |
| 2004 | 16,226.8 | 17,514.6 | 19,119.2 | 19,054.0 | 18,563.3 | 19,572.4 | 20,122.8 | 20,277.9 | 19,342.7 | 18,766.0 | 19,820.2 | 21,361.2 |
| 2005 | 18,943.6 | 19,789.8 | 21,024.1 | 20,366.8 | 22,254.5 | 22,515.4 | 22,292.1 | 23,404.5 | 21,243.3 | 20,918.1 | 21,407.2 | 20,843.7 |
| 2006 | 19,682.3 | 21,163.8 | 21,331.3 | 22,149.7 | 22,296.1 | 24,353.6 | 24,160.4 | 24,931.9 | 23,895.9 | 23,286.2 | 22,852.6 | 22,837.6 |
| 2007 | 22,149.4 | 21,904.0 | 23,024.1 | W | 22,863.8 | 23,573.5 | 23,192.6 | 23,719.9 | 22,346.4 | 21,866.6 | W | 21,187.7 |
| 2008 | 20,421.3 | W | W | W | W | W | 22,659.6 | 23,244.1 | 22,417.6 | 23,276.2 | 23,136.5 | 22,796.2 |
| 2009 | W | W | W | 22,669.8 | 23,276.6 | 24,159.9 | 24,182.4 | 24,245.1 | 24,120.0 | 23,507.5 | 22,695.2 | 23,597.2 |
| 2010 | 22,050.1 | 23,967.1 | W | W | W | 25,025.1 | 25,955.7 | 26,108.8 | 26,288.0 | 25,528.1 | 24,528.9 | 24,836.6 |
| 2011 | W | 24,889.3 | 24,760.9 | 24,899.3 | 25,352.2 | 26,154.1 | 26,251.1 | 28,075.5 | 27,799.0 | 27,257.3 | 27,745.1 | 28,066.9 |
| 2012 | 25,732.2 | 27,313.8 | 27,536.6 | 27,428.1 | 28,373.8 | 29,214.3 | 28,730.4 | 30,137.6 | 27,991.6 | W | 27,565.0 | 26,845.2 |
| 2013 | 27,145.7 | 26,864.5 | 27,551.1 | 27,438.1 | 28,200.2 | 28,779.6 | 29,504.5 | 30,251.4 | 28,730.7 | 29,162.5 | 28,090.7 | 28,083.5 |
| 2014 | 26,741.1 | 28,118.6 | 29,999.2 | 30,830.4 | 30,973.0 | 30,953.9 | 31,955.3 | 32,362.9 | 30,968.1 | 31,483.1 | 30,229.7 | 31,040.9 |
| 2015 | 30,108.8 | 30,778.3 | 31,290.9 | 32,299.0 | 32,038.3 | 32,968.2 | 33,306.4 | 33,638.1 | 32,966.4 | 32,817.0 | 31,787.7 | 32,034.7 |
| 2016 | 30,903.6 | 32,595.1 | 32,525.0 | 33,686.0 | 33,373.9 | 34,052.9 | 34,184.7 | 35,178.8 | 33,627.3 | 33,714.5 | 33,459.6 | 33,086.3 |
| 2017 | 31,190.9 | 32,640.8 | 34,685.5 | 35,089.2 | 34,831.6 | 36,072.5 | 36,150.6 | 37,629.2 | 35,554.7 | 35,682.5 | 34,928.2 | 34,911.5 |
| 2018 | 32,932.7 | 34,551.4 | 34,889.9 | 35,084.8 | 35,395.0 | 35,738.5 | 35,288.3 | 36,364.7 | 34,555.6 | 34,316.3 | 33,595.0 | 33,129.6 |
| 2019 | 31,999.1 | 32,254.9 | 32,046.1 | 34,179.1 | 34,405.0 | 36,054.3 | 35,264.8 | 36,337.9 | 34,707.2 | 35,132.3 | 33,832.7 | 33,286.4 |
| 2020 | 32,166.8 | 33,335.7 | W | W | 25,074.1 | 29,227.8 | 31,125.4 | W | 30,365.9 | W | W | 28,658.6 |
| 2021 | W | W | W | W | 32,394.5 | 33,696.3 | W | W | W | 31,889.3 | 31,338.2 | 31,854.5 |
| 2022 | W | W | W | |||||||||
| - = No Data Reported; -- = Not Applicable; NA = Not Available; W = Withheld to avoid disclosure of individual company data. |
| Release Date: 6/1/2022 |
| Next Release Date: TBD |