|
Download Data (XLS File) |
|
||||||||
|
||||||||
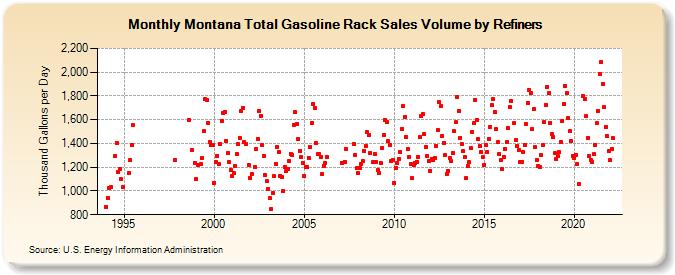
| Montana Total Gasoline Rack Sales Volume by Refiners (Thousand Gallons per Day) | ||||||||
| Year | Jan | Feb | Mar | Apr | May | Jun | Jul | Aug | Sep | Oct | Nov | Dec |
|---|---|---|---|---|---|---|---|---|---|---|---|---|
| 1994 | 868.6 | 940.1 | 1,021.6 | 1,029.4 | W | W | 1,292.9 | 1,404.2 | 1,163.5 | 1,188.6 | 1,097.7 | 1,030.3 |
| 1995 | W | W | W | 1,150.2 | 1,260.0 | 1,386.0 | 1,552.7 | W | W | W | W | W |
| 1996 | W | W | W | W | W | W | W | W | W | W | W | W |
| 1997 | W | W | W | W | W | W | W | W | W | W | 1,263.0 | W |
| 1998 | W | W | W | W | W | W | W | 1,596.8 | W | 1,346.1 | W | 1,237.9 |
| 1999 | 1,099.5 | 1,222.1 | W | 1,224.0 | 1,281.0 | 1,500.9 | 1,773.4 | 1,768.0 | 1,575.5 | 1,416.2 | 1,385.0 | 1,386.3 |
| 2000 | 1,069.6 | 1,246.8 | 1,297.1 | 1,222.9 | 1,398.5 | 1,592.6 | 1,654.0 | 1,668.5 | 1,423.1 | 1,318.9 | 1,240.8 | 1,174.1 |
| 2001 | 1,128.7 | 1,149.4 | 1,206.2 | 1,314.8 | 1,392.9 | 1,448.3 | 1,673.2 | 1,701.6 | 1,411.8 | 1,391.4 | W | 1,216.5 |
| 2002 | 1,111.5 | 1,143.6 | W | 1,202.2 | 1,354.5 | 1,440.8 | 1,674.7 | 1,633.5 | 1,384.5 | 1,294.3 | 1,132.1 | 1,081.1 |
| 2003 | 1,020.4 | 940.5 | 849.8 | 984.3 | 1,123.2 | 1,227.9 | 1,374.0 | 1,329.7 | 1,129.3 | 1,113.6 | 1,000.8 | 1,204.1 |
| 2004 | 1,164.1 | 1,184.5 | 1,255.8 | 1,312.8 | 1,303.4 | 1,557.5 | 1,662.1 | 1,566.8 | 1,437.7 | 1,340.3 | 1,284.7 | 1,238.6 |
| 2005 | 1,122.5 | 1,201.8 | 1,198.5 | 1,280.4 | 1,370.5 | 1,572.8 | 1,731.1 | 1,698.6 | 1,401.0 | 1,310.4 | 1,307.1 | 1,286.6 |
| 2006 | 1,142.0 | 1,213.5 | 1,232.4 | 1,284.8 | W | W | W | W | W | W | W | W |
| 2007 | W | 1,239.0 | W | 1,246.5 | 1,354.5 | W | W | W | W | 1,397.1 | 1,306.0 | 1,193.3 |
| 2008 | 1,147.2 | 1,193.2 | 1,226.6 | 1,249.0 | 1,340.1 | 1,379.3 | 1,493.3 | 1,473.3 | 1,318.4 | W | 1,243.0 | 1,310.2 |
| 2009 | 1,245.5 | 1,173.5 | 1,154.2 | 1,234.6 | 1,363.9 | 1,469.4 | 1,595.8 | 1,580.3 | 1,416.3 | 1,385.2 | 1,249.3 | 1,261.1 |
| 2010 | 1,065.1 | 1,196.3 | 1,238.8 | 1,272.6 | 1,329.1 | 1,524.6 | 1,712.0 | 1,625.3 | 1,455.3 | 1,350.6 | 1,285.8 | 1,223.2 |
| 2011 | 1,106.9 | 1,219.5 | 1,237.5 | 1,246.8 | 1,289.9 | 1,450.7 | 1,629.5 | 1,647.9 | 1,477.2 | 1,370.0 | 1,296.6 | 1,249.1 |
| 2012 | 1,171.7 | 1,271.5 | 1,256.9 | 1,280.4 | 1,379.6 | 1,510.9 | 1,747.1 | 1,713.7 | 1,463.2 | 1,405.6 | 1,299.9 | 1,141.5 |
| 2013 | 1,167.3 | 1,275.4 | 1,253.5 | 1,321.2 | 1,502.1 | 1,577.8 | 1,788.0 | 1,675.1 | 1,448.3 | 1,394.8 | 1,333.4 | 1,285.0 |
| 2014 | 1,106.2 | 1,210.8 | 1,240.1 | 1,358.8 | 1,497.3 | 1,568.9 | 1,766.1 | 1,597.1 | 1,435.6 | 1,375.0 | 1,325.9 | 1,284.2 |
| 2015 | 1,220.3 | 1,388.1 | 1,328.8 | 1,440.2 | 1,540.5 | 1,720.4 | 1,775.7 | 1,668.3 | 1,520.7 | 1,408.2 | 1,314.1 | 1,260.2 |
| 2016 | 1,182.4 | 1,289.4 | 1,355.8 | 1,408.3 | 1,528.0 | 1,704.6 | 1,754.5 | W | 1,568.2 | 1,425.3 | 1,375.4 | 1,343.9 |
| 2017 | 1,245.8 | 1,246.0 | 1,328.3 | 1,384.8 | 1,561.2 | 1,743.4 | 1,853.8 | 1,821.4 | 1,523.1 | 1,688.3 | 1,369.4 | 1,260.7 |
| 2018 | 1,211.9 | 1,200.8 | 1,300.1 | 1,384.9 | 1,581.6 | 1,726.4 | 1,879.2 | 1,820.3 | 1,572.9 | 1,477.8 | 1,454.2 | 1,315.8 |
| 2019 | 1,268.3 | 1,290.2 | 1,325.0 | 1,413.7 | 1,590.9 | 1,733.8 | 1,883.1 | 1,820.6 | 1,612.0 | 1,502.3 | 1,418.4 | 1,294.0 |
| 2020 | 1,278.6 | 1,305.1 | 1,225.4 | 1,062.6 | W | W | 1,795.3 | 1,772.1 | 1,628.6 | 1,444.5 | 1,294.9 | 1,262.8 |
| 2021 | 1,242.5 | 1,306.9 | 1,390.5 | 1,568.4 | 1,675.3 | 1,982.3 | 2,083.7 | 1,901.0 | 1,703.2 | 1,542.2 | 1,462.8 | 1,337.8 |
| 2022 | 1,258.4 | 1,352.2 | 1,444.5 | |||||||||
| - = No Data Reported; -- = Not Applicable; NA = Not Available; W = Withheld to avoid disclosure of individual company data. |
| Release Date: 6/1/2022 |
| Next Release Date: TBD |