|
Download Data (XLS File) |
|
||||||||
|
||||||||
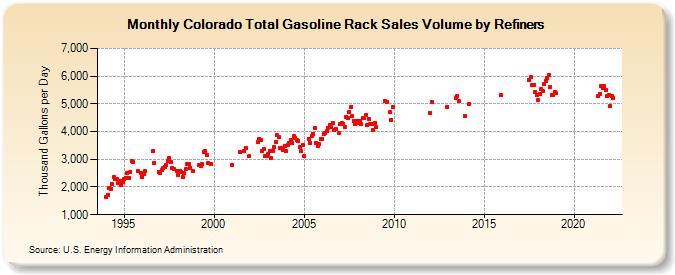
| Colorado Total Gasoline Rack Sales Volume by Refiners (Thousand Gallons per Day) | ||||||||
| Year | Jan | Feb | Mar | Apr | May | Jun | Jul | Aug | Sep | Oct | Nov | Dec |
|---|---|---|---|---|---|---|---|---|---|---|---|---|
| 1994 | 1,634.3 | 1,721.4 | 1,947.2 | 1,937.2 | 2,107.6 | 2,349.9 | 2,304.6 | 2,294.8 | 2,130.7 | 2,211.1 | 2,069.4 | 2,186.6 |
| 1995 | 2,284.7 | 2,335.2 | 2,510.1 | 2,334.7 | 2,535.0 | 2,920.1 | 2,913.4 | W | W | 2,565.4 | W | 2,520.7 |
| 1996 | 2,368.5 | 2,454.8 | 2,563.4 | W | W | W | W | 3,288.7 | 2,881.4 | W | W | 2,544.4 |
| 1997 | 2,489.0 | 2,606.4 | 2,676.2 | 2,738.2 | 2,787.4 | 2,920.7 | 3,042.5 | 2,904.3 | 2,697.6 | 2,649.1 | W | 2,584.1 |
| 1998 | 2,445.1 | 2,575.0 | 2,545.3 | 2,347.1 | 2,496.2 | 2,631.1 | 2,820.8 | 2,836.9 | 2,698.7 | W | 2,562.6 | W |
| 1999 | W | W | 2,793.6 | 2,743.2 | 2,825.3 | 3,259.4 | 3,290.3 | 3,159.5 | 2,856.1 | W | 2,821.8 | W |
| 2000 | W | W | W | W | W | W | W | W | W | W | W | W |
| 2001 | 2,782.9 | W | W | W | W | 3,257.8 | W | W | 3,290.9 | 3,404.4 | W | 3,100.1 |
| 2002 | NA | NA | NA | W | W | 3,611.9 | 3,726.4 | 3,698.3 | 3,306.5 | 3,361.2 | 3,103.7 | 3,115.0 |
| 2003 | 3,186.7 | 3,290.6 | 3,037.5 | 3,311.4 | 3,431.2 | 3,637.8 | 3,859.1 | 3,802.6 | 3,409.4 | 3,408.0 | 3,344.1 | 3,491.7 |
| 2004 | 3,305.0 | 3,500.4 | 3,590.3 | 3,685.8 | 3,581.9 | 3,824.7 | 3,774.5 | 3,705.6 | 3,672.4 | 3,449.6 | 3,283.9 | 3,515.5 |
| 2005 | 3,111.6 | W | W | 3,745.8 | 3,600.9 | 3,848.7 | 3,914.1 | 4,133.3 | 3,594.3 | 3,494.7 | 3,534.7 | 3,723.5 |
| 2006 | 3,743.2 | 3,905.3 | 3,953.5 | 4,007.7 | 4,142.8 | 4,249.7 | 4,148.9 | 4,309.6 | 4,046.6 | 4,097.4 | W | 3,946.8 |
| 2007 | 4,277.2 | 4,306.3 | 4,274.5 | 4,157.0 | 4,524.0 | 4,489.2 | 4,699.0 | 4,886.6 | 4,558.1 | 4,396.9 | 4,271.1 | 4,370.2 |
| 2008 | 4,307.7 | 4,382.3 | 4,254.6 | 4,488.3 | 4,473.5 | 4,603.7 | 4,223.9 | 4,458.2 | 4,268.8 | 4,265.3 | 4,054.6 | 4,302.4 |
| 2009 | 4,168.5 | W | W | W | W | W | 5,097.7 | 5,080.3 | W | 4,694.1 | 4,416.9 | 4,877.8 |
| 2010 | W | W | W | W | W | W | W | W | W | W | W | W |
| 2011 | W | W | W | W | W | W | W | W | W | W | W | W |
| 2012 | 4,675.7 | 5,080.1 | W | W | W | W | W | W | W | W | W | 4,894.0 |
| 2013 | W | W | W | W | W | 5,203.3 | 5,281.4 | 5,103.0 | W | W | W | 4,567.2 |
| 2014 | W | W | 4,976.6 | W | W | W | W | W | W | W | W | W |
| 2015 | W | W | W | W | W | W | W | W | W | W | W | 5,316.0 |
| 2016 | W | W | W | W | W | W | W | W | W | W | W | W |
| 2017 | W | W | W | W | W | W | 5,868.6 | 5,966.1 | 5,685.3 | 5,676.5 | 5,430.1 | 5,311.0 |
| 2018 | 5,151.7 | 5,357.4 | 5,520.1 | 5,475.6 | 5,724.8 | 5,840.4 | 5,942.1 | 6,046.9 | 5,599.0 | 5,319.5 | 5,326.5 | 5,442.5 |
| 2019 | 5,379.8 | W | W | W | W | W | W | W | W | W | W | W |
| 2020 | W | W | W | W | W | W | W | W | W | W | W | W |
| 2021 | W | W | W | W | 5,269.7 | 5,371.6 | 5,645.0 | 5,557.2 | 5,641.3 | 5,505.2 | 5,289.5 | 5,316.3 |
| 2022 | 4,914.4 | 5,299.2 | 5,226.8 | |||||||||
| - = No Data Reported; -- = Not Applicable; NA = Not Available; W = Withheld to avoid disclosure of individual company data. |
| Release Date: 6/1/2022 |
| Next Release Date: TBD |