|
Download Data (XLS File) |
|
||||||||
|
||||||||
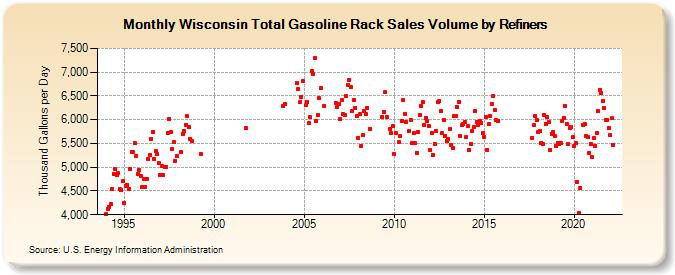
| Wisconsin Total Gasoline Rack Sales Volume by Refiners (Thousand Gallons per Day) | ||||||||
| Year | Jan | Feb | Mar | Apr | May | Jun | Jul | Aug | Sep | Oct | Nov | Dec |
|---|---|---|---|---|---|---|---|---|---|---|---|---|
| 1994 | 4,009.9 | 4,115.1 | 4,156.2 | 4,216.0 | 4,539.5 | 4,864.2 | 4,953.6 | 4,832.6 | 4,874.2 | 4,542.0 | 4,519.5 | 4,701.2 |
| 1995 | 4,252.8 | 4,602.1 | 4,632.4 | 4,544.1 | 4,955.6 | 5,322.4 | 5,324.0 | 5,499.8 | 5,236.7 | 4,856.0 | 4,940.4 | 4,812.5 |
| 1996 | 4,583.0 | 4,757.8 | 4,576.9 | 4,749.4 | 5,175.4 | 5,266.7 | 5,599.5 | 5,740.3 | 5,179.4 | 5,341.9 | 5,267.3 | 5,094.5 |
| 1997 | 4,844.5 | 5,020.0 | 4,830.4 | 4,995.0 | 5,009.6 | 5,718.8 | 6,020.8 | 5,737.1 | 5,372.6 | 5,523.9 | 5,133.3 | 5,244.0 |
| 1998 | W | W | 5,322.2 | 5,701.1 | 5,771.1 | 5,895.7 | 6,070.0 | 5,852.5 | 5,599.2 | 5,556.4 | W | W |
| 1999 | W | W | W | 5,279.9 | W | W | W | W | W | W | W | W |
| 2000 | W | W | W | W | W | W | W | W | W | W | W | W |
| 2001 | W | W | W | W | W | W | W | W | W | 5,820.6 | W | W |
| 2002 | W | W | W | W | W | W | W | W | W | W | W | W |
| 2003 | W | W | W | W | W | W | W | W | W | W | 6,282.4 | 6,329.5 |
| 2004 | W | W | W | W | W | W | W | 6,763.8 | 6,648.9 | 6,364.9 | 6,474.4 | 6,814.1 |
| 2005 | W | 6,300.3 | 6,369.4 | 5,923.6 | 6,050.1 | 7,020.9 | 6,956.9 | 7,291.5 | 5,977.0 | 6,103.3 | 6,455.5 | 6,664.1 |
| 2006 | W | 6,285.9 | W | W | W | W | W | W | W | 6,353.8 | 6,272.8 | 6,335.2 |
| 2007 | 6,012.5 | 6,403.7 | 6,111.9 | 6,108.7 | 6,499.0 | 6,731.0 | 6,839.6 | 6,683.2 | 6,186.8 | 6,419.1 | 6,251.9 | 6,066.9 |
| 2008 | 5,620.8 | 6,109.7 | 5,450.9 | 5,673.5 | 6,191.1 | 6,128.6 | 6,255.5 | W | 5,812.6 | W | W | W |
| 2009 | W | W | W | W | 6,062.6 | 6,167.4 | 6,581.8 | 6,049.8 | W | 5,809.8 | 5,717.2 | 5,872.4 |
| 2010 | 5,282.7 | 5,724.6 | W | 5,521.7 | 5,666.6 | 5,972.8 | 6,415.8 | 6,120.5 | 5,949.0 | W | 5,756.8 | 5,995.4 |
| 2011 | 5,500.7 | 5,710.1 | 5,503.8 | 5,299.5 | 5,748.0 | 6,096.2 | 6,293.4 | 6,368.9 | 5,893.2 | 6,036.4 | 5,965.0 | 5,877.2 |
| 2012 | 5,368.9 | 5,728.6 | 5,261.0 | 5,489.0 | 5,768.5 | 6,366.3 | 6,383.7 | 6,179.9 | 5,716.8 | 5,999.4 | 5,662.4 | 5,544.5 |
| 2013 | 5,588.8 | 5,808.3 | 5,476.8 | 5,403.9 | 6,068.0 | 6,071.0 | 6,264.6 | 6,367.3 | 5,658.3 | 5,882.0 | 5,911.1 | 5,945.8 |
| 2014 | 5,627.8 | 5,861.4 | 5,365.6 | 5,497.7 | 5,760.4 | 5,843.6 | 6,180.5 | 5,958.6 | 5,883.1 | 5,968.3 | 5,931.8 | 5,726.6 |
| 2015 | 5,627.1 | 6,062.6 | 5,369.2 | 5,908.6 | 6,082.2 | 6,338.1 | 6,488.9 | 6,211.4 | 5,983.3 | 5,975.7 | W | W |
| 2016 | W | W | W | W | W | W | W | W | W | W | W | W |
| 2017 | W | W | W | W | W | W | W | W | 5,616.5 | 5,884.6 | 6,071.7 | 5,993.1 |
| 2018 | 5,738.9 | 5,758.5 | 5,513.1 | 5,484.7 | 6,100.3 | 5,910.6 | 6,048.3 | 5,950.0 | 5,363.7 | 5,705.9 | 5,735.4 | 5,654.9 |
| 2019 | 5,444.7 | 5,516.0 | 5,485.8 | 5,511.8 | 5,961.6 | 6,042.5 | 6,282.6 | 5,917.5 | 5,486.2 | 5,828.6 | 5,839.5 | 5,626.8 |
| 2020 | 5,440.6 | 5,500.7 | 4,698.5 | 4,042.0 | 4,556.5 | W | 5,888.3 | 5,913.3 | 5,648.5 | 5,643.5 | 5,303.3 | 5,489.5 |
| 2021 | 5,215.0 | 5,621.6 | 5,453.8 | 5,722.7 | 6,183.2 | 6,625.6 | 6,571.0 | 6,386.4 | 6,240.5 | 5,990.8 | 5,995.9 | 5,828.8 |
| 2022 | 5,671.4 | 6,026.9 | 5,471.2 | |||||||||
| - = No Data Reported; -- = Not Applicable; NA = Not Available; W = Withheld to avoid disclosure of individual company data. |
| Release Date: 6/1/2022 |
| Next Release Date: TBD |