|
Download Data (XLS File) |
|
||||||||
|
||||||||
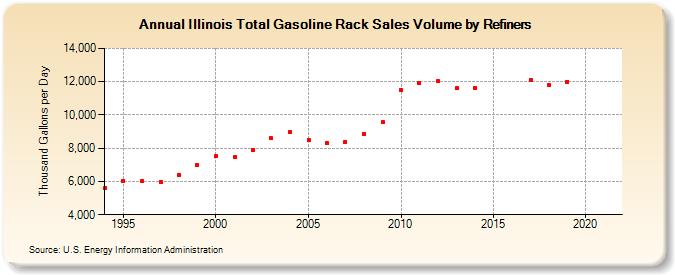
| Illinois Total Gasoline Rack Sales Volume by Refiners (Thousand Gallons per Day) | ||||||||
| Decade | Year-0 | Year-1 | Year-2 | Year-3 | Year-4 | Year-5 | Year-6 | Year-7 | Year-8 | Year-9 |
|---|---|---|---|---|---|---|---|---|---|---|
| 1990's | 5,584.1 | 6,055.3 | 6,011.8 | 5,988.3 | 6,395.6 | 7,010.8 | ||||
| 2000's | 7,506.5 | 7,446.2 | 7,874.8 | 8,592.6 | 8,977.9 | 8,477.0 | 8,288.8 | 8,401.1 | 8,859.6 | 9,557.6 |
| 2010's | 11,516.1 | 11,922.2 | 12,016.4 | 11,600.5 | 11,639.0 | W | W | 12,075.5 | 11,825.9 | 12,000.4 |
| 2020's | W |
| - = No Data Reported; -- = Not Applicable; NA = Not Available; W = Withheld to avoid disclosure of individual company data. |
| Release Date: 6/1/2022 |
| Next Release Date: TBD |