|
Download Data (XLS File) |
|
||||||||
|
||||||||
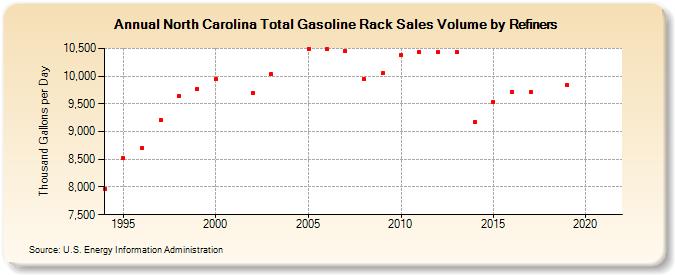
| North Carolina Total Gasoline Rack Sales Volume by Refiners (Thousand Gallons per Day) | ||||||||
| Decade | Year-0 | Year-1 | Year-2 | Year-3 | Year-4 | Year-5 | Year-6 | Year-7 | Year-8 | Year-9 |
|---|---|---|---|---|---|---|---|---|---|---|
| 1990's | 7,965.9 | 8,519.1 | 8,710.8 | 9,208.7 | 9,648.4 | 9,770.0 | ||||
| 2000's | 9,940.3 | W | 9,701.7 | 10,033.6 | W | 10,493.6 | 10,488.9 | 10,452.6 | 9,948.9 | 10,048.6 |
| 2010's | 10,378.6 | 10,434.8 | 10,436.0 | 10,435.1 | 9,176.5 | 9,533.5 | 9,720.0 | 9,714.5 | W | 9,837.9 |
| 2020's | W |
| - = No Data Reported; -- = Not Applicable; NA = Not Available; W = Withheld to avoid disclosure of individual company data. |
| Release Date: 6/1/2022 |
| Next Release Date: TBD |