|
Download Data (XLS File) |
|
||||||||
|
||||||||
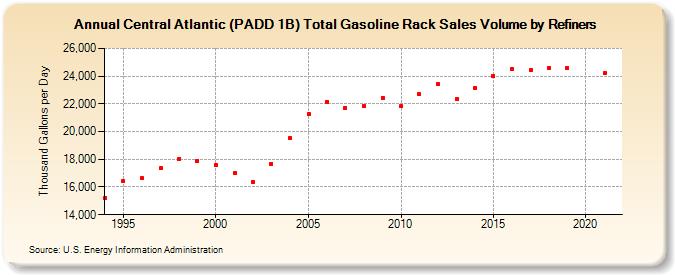
| Central Atlantic (PADD 1B) Total Gasoline Rack Sales Volume by Refiners (Thousand Gallons per Day) | ||||||||
| Decade | Year-0 | Year-1 | Year-2 | Year-3 | Year-4 | Year-5 | Year-6 | Year-7 | Year-8 | Year-9 |
|---|---|---|---|---|---|---|---|---|---|---|
| 1990's | 15,224.7 | 16,417.1 | 16,625.4 | 17,343.6 | 18,019.9 | 17,893.1 | ||||
| 2000's | 17,604.7 | 16,996.0 | 16,326.5 | 17,665.2 | 19,533.8 | 21,269.8 | 22,161.9 | 21,713.8 | 21,841.8 | 22,449.0 |
| 2010's | 21,814.5 | 22,686.3 | 23,424.7 | 22,339.7 | 23,155.3 | 24,007.0 | 24,504.2 | 24,406.8 | 24,594.6 | 24,569.7 |
| 2020's | W |
| - = No Data Reported; -- = Not Applicable; NA = Not Available; W = Withheld to avoid disclosure of individual company data. |
| Release Date: 6/1/2022 |
| Next Release Date: TBD |