|
Download Data (XLS File) |
|
||||||||
|
||||||||
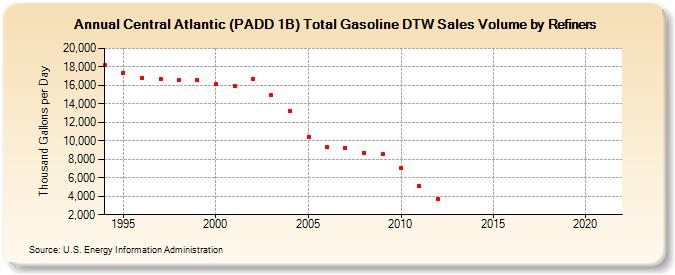
| Central Atlantic (PADD 1B) Total Gasoline DTW Sales Volume by Refiners (Thousand Gallons per Day) | ||||||||
| Decade | Year-0 | Year-1 | Year-2 | Year-3 | Year-4 | Year-5 | Year-6 | Year-7 | Year-8 | Year-9 |
|---|---|---|---|---|---|---|---|---|---|---|
| 1990's | 18,152.7 | 17,369.4 | 16,768.6 | 16,715.8 | 16,586.6 | 16,530.1 | ||||
| 2000's | 16,098.5 | 15,906.2 | 16,696.7 | 14,907.3 | 13,238.8 | 10,431.5 | 9,348.5 | 9,238.4 | 8,715.5 | 8,531.2 |
| 2010's | 7,079.8 | 5,120.3 | 3,681.8 | W | W | W | W | W | W | W |
| 2020's | W |
| - = No Data Reported; -- = Not Applicable; NA = Not Available; W = Withheld to avoid disclosure of individual company data. |
| Release Date: 6/1/2022 |
| Next Release Date: TBD |