|
Download Data (XLS File) |
|
||||||||
|
||||||||
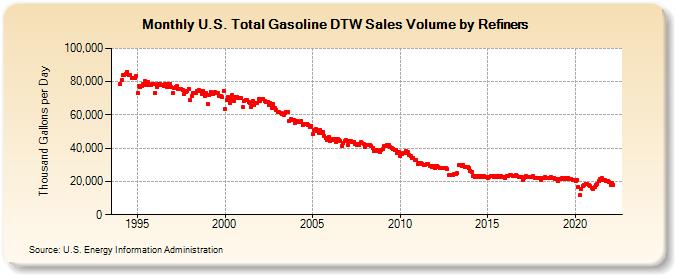
| U.S. Total Gasoline DTW Sales Volume by Refiners (Thousand Gallons per Day) | ||||||||
| Year | Jan | Feb | Mar | Apr | May | Jun | Jul | Aug | Sep | Oct | Nov | Dec |
|---|---|---|---|---|---|---|---|---|---|---|---|---|
| 1994 | 78,440.4 | 81,012.3 | 84,100.2 | 84,217.9 | 84,502.0 | 86,025.8 | 84,243.5 | 84,283.1 | 82,176.5 | 82,460.7 | 82,151.1 | 83,673.7 |
| 1995 | 73,468.1 | 77,422.6 | 77,084.9 | 77,624.3 | 78,786.7 | 80,217.7 | 78,090.6 | 79,691.6 | 77,735.8 | 77,803.5 | 78,648.8 | 78,750.1 |
| 1996 | 73,330.4 | 76,787.0 | 78,676.6 | 78,745.9 | 77,884.9 | 78,061.4 | 77,368.7 | 78,765.3 | 76,646.3 | 78,530.0 | 78,798.9 | 76,900.7 |
| 1997 | 73,477.5 | 75,981.0 | 76,612.7 | 77,114.5 | 75,373.6 | 75,854.9 | 75,420.5 | 75,259.9 | 72,505.5 | 73,861.0 | 74,674.6 | 75,719.6 |
| 1998 | 68,733.6 | 71,387.4 | 73,187.9 | 72,946.2 | 73,289.1 | 74,591.3 | 74,974.0 | 74,347.9 | 72,848.1 | 74,404.6 | 71,583.4 | 72,998.2 |
| 1999 | 66,655.9 | 71,866.3 | 74,009.5 | 72,561.9 | 72,633.6 | 73,507.1 | 73,379.2 | 73,312.9 | 71,486.2 | 71,354.1 | 70,604.9 | 74,426.5 |
| 2000 | 63,374.0 | 68,923.1 | 70,715.5 | 67,218.0 | 69,600.9 | 71,880.2 | 68,531.2 | 70,960.6 | 70,999.1 | 70,277.1 | 70,174.9 | 70,275.7 |
| 2001 | 64,960.5 | 68,556.3 | 69,093.5 | 69,005.4 | 67,778.2 | 66,903.4 | 64,596.3 | 68,131.4 | 65,786.1 | 67,384.4 | 66,980.8 | 69,379.4 |
| 2002 | 68,347.3 | 69,399.5 | 69,637.5 | 68,174.3 | 67,503.0 | 68,048.1 | 66,176.3 | 66,955.9 | 64,445.3 | 66,417.1 | 64,208.6 | 63,084.6 |
| 2003 | 61,802.8 | 61,782.3 | 61,336.3 | 60,786.8 | 59,889.8 | 61,397.1 | 61,481.8 | 62,032.8 | 56,228.0 | 57,580.3 | 56,750.0 | 57,172.6 |
| 2004 | 55,262.0 | 56,593.8 | 55,851.5 | 55,453.9 | 56,219.9 | 53,727.3 | 54,403.2 | 54,735.7 | 54,652.3 | 54,238.6 | 52,984.6 | 53,550.0 |
| 2005 | 48,447.9 | 50,996.6 | 51,293.3 | 50,258.4 | 49,254.4 | 50,834.1 | 49,405.5 | 49,667.8 | 47,187.8 | 45,850.9 | 45,085.9 | 46,646.4 |
| 2006 | 44,155.5 | 44,839.2 | 45,454.9 | 45,265.8 | 43,974.5 | 45,546.2 | 45,058.8 | 44,037.8 | 41,470.6 | 42,983.7 | 44,223.0 | 44,689.5 |
| 2007 | 42,022.0 | 44,064.6 | 44,379.0 | 43,668.3 | 43,725.0 | 42,616.1 | 41,901.2 | 42,676.7 | 41,873.2 | 43,818.5 | 42,933.3 | 42,533.5 |
| 2008 | 40,456.2 | 42,128.2 | 42,161.2 | 41,932.6 | 41,035.3 | 40,241.5 | 38,418.5 | 38,350.2 | 38,803.8 | 38,456.0 | 37,965.3 | 38,951.6 |
| 2009 | 39,376.0 | 41,127.1 | 41,513.0 | 41,701.2 | 41,853.2 | 40,676.3 | 40,050.1 | 39,730.3 | 38,812.0 | 38,752.3 | 37,385.8 | 37,860.5 |
| 2010 | 35,284.5 | 36,732.0 | 37,357.2 | 37,069.9 | 38,085.5 | 37,631.4 | 36,104.3 | 35,354.6 | 34,332.1 | 34,102.2 | 33,170.9 | 32,669.2 |
| 2011 | 30,658.5 | 31,212.4 | 30,941.8 | 30,694.5 | 29,911.2 | 30,147.4 | 30,425.2 | 30,191.5 | 29,492.8 | 29,402.5 | 28,869.5 | 29,382.0 |
| 2012 | 27,977.2 | 29,255.1 | 28,757.0 | 28,275.6 | 28,257.6 | 28,258.1 | 27,979.5 | 28,289.1 | 27,555.1 | 23,969.7 | 23,699.5 | 23,872.6 |
| 2013 | 23,675.0 | 24,257.2 | 24,584.5 | 24,954.1 | 29,704.3 | 30,138.3 | 29,222.8 | 30,011.9 | 28,893.5 | 28,649.0 | 28,668.9 | 27,864.8 |
| 2014 | 26,458.7 | 25,838.4 | 23,028.7 | 22,836.2 | 23,371.7 | 23,168.2 | 22,713.4 | 23,430.4 | 22,864.9 | 23,152.3 | 22,749.5 | 22,748.9 |
| 2015 | 21,946.2 | 22,890.5 | 23,148.6 | 23,147.5 | 22,743.0 | 23,239.5 | 22,720.2 | 23,215.2 | 22,958.9 | 23,071.5 | 22,730.1 | 22,944.5 |
| 2016 | 22,113.7 | 23,330.5 | 23,415.5 | 23,708.7 | 23,650.1 | 23,557.3 | 23,349.9 | 23,928.4 | 23,370.6 | 22,970.1 | 22,541.9 | 22,821.9 |
| 2017 | 21,158.5 | 21,994.1 | 22,996.0 | 22,697.7 | 22,755.6 | 22,840.2 | 22,612.5 | 23,002.7 | 22,345.0 | 22,291.5 | 21,875.2 | 21,862.4 |
| 2018 | 20,660.1 | 21,776.4 | 22,297.1 | 22,604.3 | 22,296.3 | 22,362.2 | 22,311.7 | 22,771.4 | 22,103.1 | 21,885.8 | 21,538.5 | 21,490.5 |
| 2019 | 20,271.6 | 21,259.1 | 21,562.7 | 21,854.8 | 21,658.8 | 21,937.8 | 21,518.4 | 22,294.3 | 21,616.4 | 21,336.9 | 20,971.4 | 20,815.2 |
| 2020 | 20,333.9 | 21,121.3 | 16,779.7 | 11,623.6 | 15,258.0 | 17,407.8 | 17,938.1 | 18,552.4 | 18,245.4 | 18,155.6 | 17,000.6 | 16,085.4 |
| 2021 | 15,707.7 | 16,613.4 | 17,680.9 | 18,581.2 | 20,056.5 | 21,728.4 | 21,774.2 | 21,165.5 | 20,966.7 | 20,385.1 | 20,081.4 | 19,587.5 |
| 2022 | 17,940.9 | 19,063.8 | 17,988.5 | |||||||||
| - = No Data Reported; -- = Not Applicable; NA = Not Available; W = Withheld to avoid disclosure of individual company data. |
| Release Date: 6/1/2022 |
| Next Release Date: TBD |