|
Download Data (XLS File) |
|
||||||||
|
||||||||
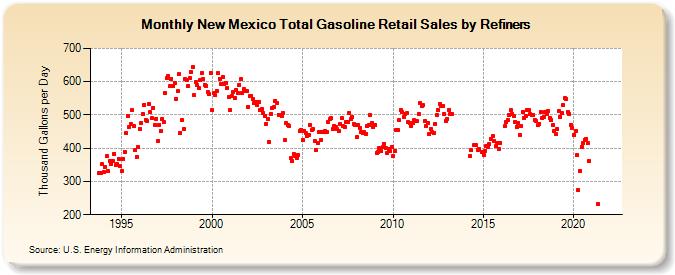
| New Mexico Total Gasoline Retail Sales by Refiners (Thousand Gallons per Day) | ||||||||
| Year | Jan | Feb | Mar | Apr | May | Jun | Jul | Aug | Sep | Oct | Nov | Dec |
|---|---|---|---|---|---|---|---|---|---|---|---|---|
| 1993 | 324.7 | 324.4 | 351.2 | |||||||||
| 1994 | 327.3 | 344.7 | 375.1 | 330.9 | 360.6 | 353.7 | 360.5 | 383.9 | 350.6 | 351.1 | 368.7 | 346.5 |
| 1995 | 330.6 | 367.7 | 389.4 | 444.5 | 496.7 | 462.2 | 472.2 | 513.6 | 466.5 | 394.7 | 374.5 | 404.1 |
| 1996 | 458.0 | 477.2 | 502.8 | 531.0 | 485.4 | 480.5 | 533.3 | 507.7 | 490.0 | 520.8 | 468.9 | 488.9 |
| 1997 | 421.7 | 470.7 | 453.0 | 487.8 | 477.7 | 565.6 | 610.1 | 617.4 | 586.1 | 609.0 | 587.5 | 596.3 |
| 1998 | 549.2 | 571.8 | 622.6 | 446.7 | 484.1 | 457.6 | 608.0 | 604.5 | 586.7 | 610.1 | 629.2 | 643.6 |
| 1999 | 559.3 | 600.4 | 589.4 | 579.7 | 603.6 | 626.7 | 607.3 | 591.3 | 587.2 | 568.0 | 562.1 | 626.2 |
| 2000 | 514.0 | 565.3 | 559.7 | 572.7 | 626.3 | 609.2 | 592.0 | 613.8 | 593.5 | 595.9 | 580.4 | 552.5 |
| 2001 | 514.3 | 556.7 | 569.6 | 551.6 | 575.7 | 565.7 | 590.6 | 607.1 | 566.3 | 577.8 | 571.3 | 571.1 |
| 2002 | 524.0 | 555.4 | 556.5 | 546.9 | 536.7 | 538.5 | 531.1 | 539.6 | 514.8 | 518.2 | 506.2 | 496.7 |
| 2003 | 473.5 | 488.9 | 419.0 | 503.6 | 521.2 | 523.8 | 543.3 | 536.9 | 500.4 | 500.4 | 497.4 | 506.6 |
| 2004 | 423.5 | 475.0 | 469.2 | 466.7 | 369.6 | 361.9 | 382.8 | 378.0 | 370.2 | 380.3 | 450.8 | 454.5 |
| 2005 | 424.3 | 451.9 | 444.5 | 436.9 | 440.9 | 470.9 | 454.7 | 457.0 | 421.4 | 394.7 | 415.7 | 449.9 |
| 2006 | 423.4 | 448.3 | 449.8 | 452.1 | 449.1 | 479.6 | 487.0 | 489.4 | 458.1 | 467.2 | 462.8 | 456.3 |
| 2007 | 450.4 | 473.3 | 490.5 | 465.3 | 462.6 | 478.8 | 478.7 | 506.0 | 487.5 | 494.1 | 472.9 | 470.8 |
| 2008 | 432.5 | 469.2 | 461.9 | 448.8 | 444.8 | 447.2 | 443.8 | 467.4 | 469.5 | 498.4 | 476.9 | 465.1 |
| 2009 | 471.2 | 386.4 | 389.4 | 400.8 | 391.7 | 402.6 | 413.9 | 399.6 | 387.0 | 397.6 | 390.7 | 403.6 |
| 2010 | 375.1 | 392.9 | 453.7 | 454.5 | 483.8 | 514.4 | 510.1 | 494.9 | 502.9 | 504.8 | 478.0 | 475.4 |
| 2011 | 467.3 | 475.4 | 483.8 | 482.0 | 480.4 | 502.8 | 534.5 | 526.3 | 529.2 | 481.0 | 465.4 | 474.3 |
| 2012 | 442.5 | 457.0 | 449.7 | 445.5 | 474.0 | 500.2 | 514.0 | 532.8 | 527.6 | 528.1 | 502.6 | 483.0 |
| 2013 | 488.9 | 514.8 | 504.0 | 502.5 | W | W | W | W | W | W | W | W |
| 2014 | W | W | W | 375.6 | 393.1 | NA | 409.5 | 408.6 | 395.8 | 398.8 | NA | 389.2 |
| 2015 | 379.7 | 392.8 | 406.7 | 404.3 | 411.2 | 426.9 | 435.7 | 421.9 | 405.5 | 415.4 | 397.8 | 416.4 |
| 2016 | NA | NA | 465.8 | 478.3 | 485.5 | 498.4 | 513.9 | 502.7 | 496.5 | 479.8 | 465.1 | 476.7 |
| 2017 | 440.3 | 466.0 | 510.2 | 491.6 | 497.2 | 515.6 | 514.0 | 501.4 | 499.6 | 500.4 | 485.0 | 482.3 |
| 2018 | 468.9 | 473.3 | 509.0 | 489.3 | 495.2 | 507.3 | 501.9 | 512.1 | 491.7 | 485.0 | 469.4 | 451.7 |
| 2019 | 441.5 | 457.8 | 511.1 | 494.8 | 505.0 | 529.4 | 550.4 | 549.0 | 508.6 | 503.2 | 470.9 | 461.4 |
| 2020 | 440.5 | 450.9 | 379.3 | 274.2 | 331.9 | 404.7 | 415.1 | 424.6 | 429.0 | 417.0 | 361.1 | W |
| 2021 | W | W | W | W | 231.8 | W | W | W | W | W | W | W |
| 2022 | W | W | W | |||||||||
| - = No Data Reported; -- = Not Applicable; NA = Not Available; W = Withheld to avoid disclosure of individual company data. |
| Release Date: 6/1/2022 |
| Next Release Date: TBD |