|
Download Data (XLS File) |
|
||||||||
|
||||||||
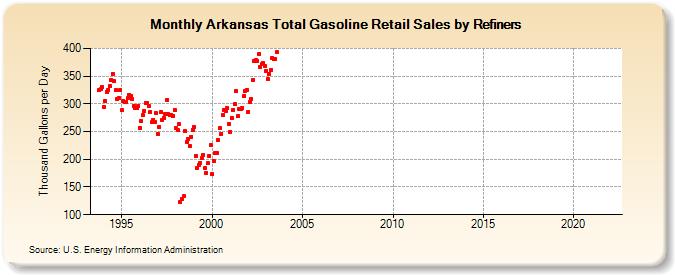
| Arkansas Total Gasoline Retail Sales by Refiners (Thousand Gallons per Day) | ||||||||
| Year | Jan | Feb | Mar | Apr | May | Jun | Jul | Aug | Sep | Oct | Nov | Dec |
|---|---|---|---|---|---|---|---|---|---|---|---|---|
| 1993 | 324.1 | 326.2 | 330.6 | |||||||||
| 1994 | 294.5 | 305.4 | 321.8 | 325.3 | 331.8 | 343.1 | 354.4 | 340.3 | 324.3 | 309.2 | 310.2 | 324.8 |
| 1995 | 288.3 | 305.4 | 304.1 | 303.9 | 310.4 | 316.8 | 314.6 | 309.5 | 296.6 | 292.7 | 292.8 | 296.7 |
| 1996 | 257.3 | 268.2 | 279.4 | 286.9 | 302.3 | 301.4 | 295.8 | 285.0 | 266.7 | 271.2 | 266.8 | 283.0 |
| 1997 | 245.8 | 258.6 | 284.5 | 271.6 | 273.7 | 281.4 | 307.5 | 280.9 | 279.3 | 280.7 | 278.3 | 289.6 |
| 1998 | 256.2 | 252.9 | 262.8 | 123.0 | 127.7 | 133.1 | 251.7 | 231.5 | 237.3 | 224.8 | 240.8 | 253.5 |
| 1999 | 258.4 | 206.1 | 185.0 | 189.7 | 193.4 | 201.5 | 207.8 | 183.6 | 175.7 | 192.5 | 206.4 | 225.7 |
| 2000 | 173.8 | 197.3 | 211.7 | 211.7 | 234.9 | 255.9 | 246.3 | 279.9 | 289.5 | 287.8 | 292.0 | 264.3 |
| 2001 | 250.0 | 274.6 | 289.2 | 298.8 | 322.8 | 278.0 | 290.9 | 290.2 | 293.1 | 313.9 | 323.8 | 325.1 |
| 2002 | 285.5 | 302.9 | 308.4 | 342.8 | 376.9 | 379.0 | 377.2 | 390.4 | 366.5 | 371.2 | 373.7 | 368.4 |
| 2003 | 359.7 | 344.2 | 354.6 | 361.5 | 382.3 | 380.2 | 381.3 | 393.3 | W | W | W | W |
| 2004 | W | W | W | W | W | W | W | W | W | W | W | W |
| 2005 | W | W | W | W | W | W | W | W | W | W | W | W |
| 2006 | W | W | W | W | W | W | W | W | W | W | W | W |
| 2007 | W | W | W | W | W | W | W | W | W | W | W | W |
| 2008 | W | W | W | W | W | W | W | W | W | W | W | W |
| 2009 | W | W | W | W | W | W | W | W | W | W | W | W |
| 2010 | W | W | W | W | W | W | W | W | W | W | W | W |
| 2011 | W | W | W | W | W | W | W | W | W | W | W | W |
| 2012 | W | W | W | W | W | W | W | W | W | W | W | W |
| 2013 | W | W | W | W | W | W | W | W | W | W | W | W |
| 2014 | - | - | W | W | W | W | W | W | W | W | W | W |
| 2015 | W | W | W | W | W | W | W | W | W | W | W | W |
| 2016 | W | W | W | W | W | W | W | W | W | W | W | - |
| 2017 | - | - | - | - | - | - | - | - | - | - | - | - |
| 2018 | - | - | - | - | - | - | - | - | - | - | - | - |
| 2019 | - | - | - | - | - | - | - | - | - | - | - | - |
| 2020 | - | - | - | - | - | - | - | - | - | - | - | - |
| 2021 | - | - | - | - | - | - | - | - | W | W | - | - |
| 2022 | - | - | W | |||||||||
| - = No Data Reported; -- = Not Applicable; NA = Not Available; W = Withheld to avoid disclosure of individual company data. |
| Release Date: 6/1/2022 |
| Next Release Date: TBD |