|
Download Data (XLS File) |
|
||||||||
|
||||||||
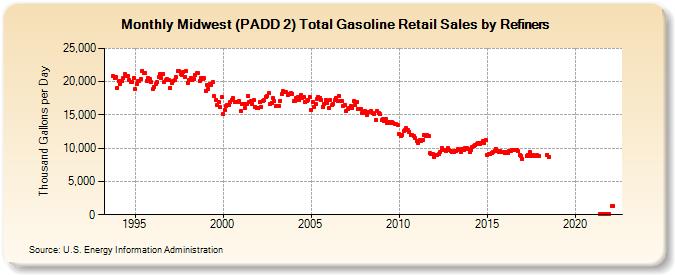
| Midwest (PADD 2) Total Gasoline Retail Sales by Refiners (Thousand Gallons per Day) | ||||||||
| Year | Jan | Feb | Mar | Apr | May | Jun | Jul | Aug | Sep | Oct | Nov | Dec |
|---|---|---|---|---|---|---|---|---|---|---|---|---|
| 1993 | 20,790.3 | 20,486.8 | 20,693.3 | |||||||||
| 1994 | 19,081.7 | 20,093.2 | 19,655.3 | 20,140.6 | 20,562.0 | 21,170.4 | 20,830.8 | 20,841.0 | 20,283.3 | 20,012.3 | 19,977.6 | 20,561.0 |
| 1995 | 18,846.8 | 19,669.5 | 20,046.3 | 20,136.2 | 20,459.0 | 21,668.0 | 21,252.6 | 21,301.6 | 20,172.2 | 20,572.3 | 20,371.4 | 19,968.5 |
| 1996 | 18,843.3 | 19,260.0 | 19,596.0 | 19,884.2 | 20,729.9 | 21,097.3 | 20,582.9 | 21,209.8 | 19,874.9 | 20,202.4 | 20,336.1 | 20,257.6 |
| 1997 | 19,097.5 | 19,747.0 | 20,114.5 | 20,244.4 | 20,655.4 | 21,548.3 | 21,535.5 | 21,218.9 | 20,969.2 | 21,482.6 | 20,758.2 | 21,562.8 |
| 1998 | 19,871.9 | 20,210.5 | 20,574.8 | 20,283.6 | 20,347.9 | 20,942.0 | 21,260.6 | 21,296.1 | 20,146.2 | 20,613.3 | 20,383.4 | 20,508.6 |
| 1999 | 18,637.5 | 19,484.0 | 18,939.6 | 19,601.2 | 19,523.5 | 19,889.3 | 17,778.8 | 17,221.1 | 16,433.8 | 16,918.3 | 16,127.8 | 17,649.9 |
| 2000 | 15,141.7 | 15,808.6 | 16,347.8 | 16,434.7 | 16,491.8 | 16,970.0 | 17,260.9 | 17,493.0 | 16,992.7 | 16,886.9 | 16,970.1 | 17,057.5 |
| 2001 | 15,585.1 | 16,647.4 | 16,569.2 | 16,088.4 | 16,667.3 | 17,856.8 | 16,902.2 | 17,078.5 | 16,701.5 | 17,180.3 | 16,234.9 | 16,064.5 |
| 2002 | 16,000.3 | 16,939.2 | 16,263.5 | 17,134.7 | 17,206.9 | 17,748.7 | 17,783.1 | 18,221.5 | 16,671.6 | 16,841.3 | 17,527.3 | 17,030.7 |
| 2003 | 16,329.5 | 16,271.2 | 16,408.0 | 17,138.0 | 18,094.8 | 18,625.4 | 18,463.2 | 18,375.9 | 18,052.7 | 18,115.0 | 18,236.2 | 18,214.1 |
| 2004 | 17,027.1 | 17,063.0 | 17,515.2 | 17,709.9 | 17,238.7 | 18,025.3 | 17,610.4 | 17,631.8 | 16,996.9 | 17,060.0 | 17,229.8 | 17,699.1 |
| 2005 | 15,798.7 | 16,922.4 | 16,235.0 | 16,661.4 | 17,427.4 | 17,759.1 | 17,553.7 | 17,264.7 | 16,263.4 | 16,676.1 | 17,239.7 | 16,813.0 |
| 2006 | 16,014.0 | 17,242.0 | 16,434.8 | 16,690.5 | 17,190.5 | 17,493.5 | 17,037.6 | 17,844.5 | 17,133.3 | 17,073.3 | 16,409.8 | 16,544.7 |
| 2007 | 15,610.5 | 15,863.7 | 15,995.7 | 16,364.7 | 15,992.1 | 17,090.0 | 16,530.5 | 16,925.0 | 15,948.2 | 15,899.6 | 15,893.1 | 15,215.9 |
| 2008 | 15,320.1 | 15,598.7 | 15,017.0 | 15,499.6 | 15,404.2 | 15,574.9 | 15,234.0 | 15,147.7 | 14,293.4 | 15,654.6 | 15,298.9 | 15,066.7 |
| 2009 | 14,189.5 | 14,362.8 | 14,056.5 | 14,325.5 | 13,814.0 | 13,880.9 | 13,793.1 | 13,899.3 | 13,813.7 | 13,629.9 | 13,606.9 | 13,463.6 |
| 2010 | 12,157.4 | 11,894.4 | 12,038.6 | 12,519.3 | 12,715.1 | 13,017.2 | 12,707.2 | 12,494.6 | 12,033.6 | 11,945.7 | 11,775.5 | 11,479.1 |
| 2011 | 11,074.0 | 10,848.6 | 11,211.7 | 11,023.3 | 11,298.1 | 11,949.1 | 11,825.5 | 11,939.4 | 11,873.0 | 9,202.8 | 9,174.7 | 9,089.6 |
| 2012 | 8,658.7 | 8,950.7 | 8,911.1 | 9,137.0 | 9,366.6 | 10,032.7 | 9,655.5 | 9,791.3 | 9,586.0 | 9,965.5 | 9,709.9 | 9,550.6 |
| 2013 | 9,361.2 | 9,398.8 | 9,611.2 | 9,572.8 | 9,838.3 | 9,653.2 | 9,475.5 | 9,844.6 | 9,778.8 | 10,021.1 | 10,069.1 | 9,855.0 |
| 2014 | 9,463.2 | 9,747.9 | 10,162.9 | 10,291.5 | 10,492.2 | 10,666.5 | 10,743.1 | 10,688.1 | 10,755.9 | 11,062.7 | 10,754.7 | 11,163.6 |
| 2015 | 9,042.4 | 9,160.1 | 9,106.2 | 9,325.7 | 9,488.1 | 9,616.6 | 9,877.1 | 9,521.4 | 9,479.0 | 9,593.7 | 9,409.2 | 9,360.7 |
| 2016 | 9,204.5 | 9,366.8 | 9,228.5 | 9,504.1 | 9,532.1 | 9,725.4 | 9,676.5 | 9,751.7 | 9,657.7 | 9,561.6 | 8,975.5 | 8,797.8 |
| 2017 | 8,431.0 | W | W | 8,827.0 | 9,003.8 | 9,389.1 | 8,852.5 | 9,028.7 | 8,810.7 | 8,886.4 | 8,901.2 | 8,832.8 |
| 2018 | W | W | W | W | W | 9,037.0 | 8,707.4 | W | W | W | W | W |
| 2019 | W | W | W | W | W | W | W | W | W | W | W | W |
| 2020 | W | W | W | W | W | W | W | W | W | W | W | W |
| 2021 | W | W | W | W | W | 131.9 | 129.2 | 139.0 | 125.7 | 126.6 | 155.9 | 146.8 |
| 2022 | W | 1,262.5 | 1,263.4 | |||||||||
| - = No Data Reported; -- = Not Applicable; NA = Not Available; W = Withheld to avoid disclosure of individual company data. |
| Release Date: 6/1/2022 |
| Next Release Date: TBD |