|
Download Data (XLS File) |
|
||||||||
|
||||||||
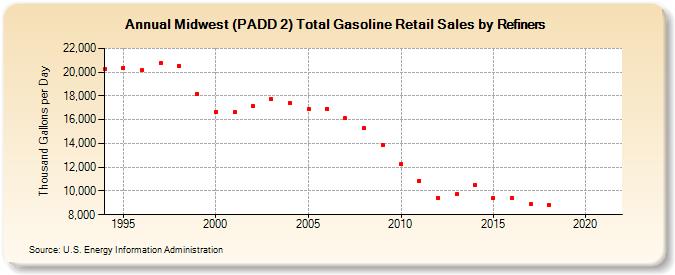
| Midwest (PADD 2) Total Gasoline Retail Sales by Refiners (Thousand Gallons per Day) | ||||||||
| Decade | Year-0 | Year-1 | Year-2 | Year-3 | Year-4 | Year-5 | Year-6 | Year-7 | Year-8 | Year-9 |
|---|---|---|---|---|---|---|---|---|---|---|
| 1990's | 20,267.5 | 20,375.5 | 20,159.6 | 20,751.2 | 20,540.3 | 18,174.9 | ||||
| 2000's | 16,657.2 | 16,630.8 | 17,113.8 | 17,701.8 | 17,401.5 | 16,883.2 | 16,923.0 | 16,110.4 | 15,258.3 | 13,899.2 |
| 2010's | 12,233.1 | 10,874.6 | 9,443.8 | 9,708.5 | 10,504.2 | 9,416.6 | 9,414.9 | 8,868.3 | 8,823.5 | W |
| 2020's | W |
| - = No Data Reported; -- = Not Applicable; NA = Not Available; W = Withheld to avoid disclosure of individual company data. |
| Release Date: 6/1/2022 |
| Next Release Date: TBD |