|
Download Data (XLS File) |
|
||||||||
|
||||||||
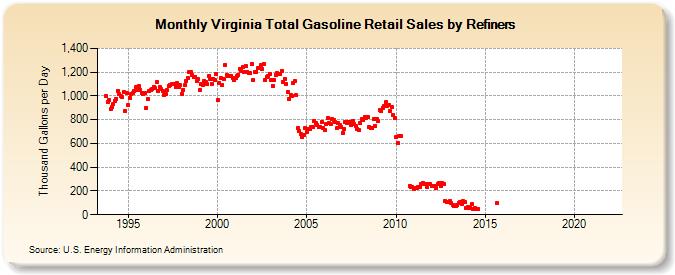
| Virginia Total Gasoline Retail Sales by Refiners (Thousand Gallons per Day) | ||||||||
| Year | Jan | Feb | Mar | Apr | May | Jun | Jul | Aug | Sep | Oct | Nov | Dec |
|---|---|---|---|---|---|---|---|---|---|---|---|---|
| 1993 | 996.2 | 947.8 | 966.3 | |||||||||
| 1994 | 886.0 | 906.0 | 934.8 | 960.7 | 977.6 | 1,045.1 | 1,012.9 | 998.4 | 988.7 | 1,034.2 | 870.5 | 1,023.5 |
| 1995 | 922.5 | 986.1 | 1,016.3 | 1,026.7 | 1,042.4 | 1,073.8 | 1,050.4 | 1,083.6 | 1,051.8 | 1,020.5 | 1,015.8 | 1,024.8 |
| 1996 | 900.0 | 975.7 | 1,039.0 | 1,051.3 | 1,055.6 | 1,076.6 | 1,063.8 | 1,116.4 | 1,043.4 | 1,072.9 | 1,057.8 | 1,043.1 |
| 1997 | 1,004.8 | 1,019.4 | 1,047.1 | 1,083.8 | 1,090.7 | 1,098.5 | 1,100.5 | 1,099.6 | 1,077.3 | 1,105.5 | 1,074.2 | 1,089.2 |
| 1998 | 1,018.5 | 1,053.1 | 1,090.9 | 1,124.1 | 1,154.2 | 1,203.3 | 1,203.0 | 1,174.0 | 1,156.9 | 1,161.3 | 1,127.6 | 1,139.8 |
| 1999 | 1,048.7 | 1,099.6 | 1,094.3 | 1,127.9 | 1,115.6 | 1,097.6 | 1,166.5 | 1,141.4 | 1,098.4 | 1,145.6 | 1,131.4 | 1,187.5 |
| 2000 | 964.5 | 1,104.9 | 1,148.2 | 1,090.4 | 1,140.4 | 1,260.3 | 1,173.8 | 1,170.7 | 1,170.3 | 1,169.9 | 1,154.9 | 1,135.2 |
| 2001 | 1,152.1 | 1,171.1 | 1,178.6 | 1,226.1 | 1,211.7 | 1,246.0 | 1,200.0 | 1,251.6 | 1,202.2 | 1,190.7 | 1,190.7 | 1,270.2 |
| 2002 | 1,132.5 | 1,197.9 | 1,204.1 | 1,232.7 | 1,238.8 | 1,259.5 | 1,226.9 | 1,264.5 | 1,136.9 | 1,159.4 | 1,163.8 | 1,186.8 |
| 2003 | 1,137.5 | 1,085.9 | 1,136.2 | 1,178.0 | 1,189.3 | 1,180.4 | 1,188.5 | 1,211.0 | 1,120.1 | 1,144.7 | 1,103.5 | 1,030.7 |
| 2004 | 975.2 | 1,006.4 | 999.0 | 1,106.0 | 1,123.9 | 1,004.4 | 725.8 | 703.7 | 678.4 | 655.7 | 674.6 | 726.2 |
| 2005 | 699.8 | 722.4 | 724.4 | 736.2 | 737.4 | 792.6 | 771.0 | 757.2 | 739.6 | 741.5 | 784.5 | 731.6 |
| 2006 | 711.0 | 764.7 | 811.4 | 772.3 | 759.5 | 805.1 | 800.5 | 783.5 | 727.3 | 768.7 | 754.3 | 735.2 |
| 2007 | 689.6 | 718.2 | 781.3 | 774.3 | 783.4 | 781.2 | 757.0 | 791.0 | 760.9 | 745.9 | 720.7 | 711.8 |
| 2008 | 769.2 | 803.9 | 794.8 | 824.0 | 818.2 | 820.1 | 740.1 | 727.1 | 727.3 | 801.6 | 749.9 | 807.6 |
| 2009 | 789.1 | 877.3 | 870.0 | 902.3 | 919.1 | 945.6 | 912.1 | 922.2 | 872.0 | 909.2 | 835.7 | 812.5 |
| 2010 | 652.5 | 599.7 | 660.9 | 659.6 | W | W | W | W | W | 241.0 | 232.6 | 233.9 |
| 2011 | 218.7 | 226.1 | 228.4 | 229.4 | 235.3 | 258.8 | 269.8 | 262.5 | 259.8 | 235.3 | 261.8 | 256.1 |
| 2012 | 245.0 | 242.8 | 243.4 | 223.8 | 260.0 | 268.4 | 244.4 | 266.4 | 258.4 | 115.5 | 107.0 | 109.3 |
| 2013 | 114.4 | 94.7 | 85.5 | 72.8 | 73.3 | 80.6 | 97.2 | 103.3 | 88.1 | 112.6 | 107.7 | 55.4 |
| 2014 | 62.0 | 54.3 | 60.0 | 88.9 | 49.7 | 54.4 | 49.5 | 46.6 | W | W | W | W |
| 2015 | W | W | W | W | W | W | W | W | 94.8 | W | W | W |
| 2016 | W | W | W | W | W | W | W | W | W | W | W | W |
| 2017 | W | W | W | W | W | W | W | W | W | W | W | W |
| 2018 | - | - | - | - | - | - | - | - | - | - | - | - |
| 2019 | - | - | - | - | W | W | W | W | W | W | W | W |
| 2020 | W | W | - | - | - | - | - | - | - | - | - | - |
| 2021 | - | - | - | - | - | - | - | - | - | - | - | - |
| 2022 | - | - | - | |||||||||
| - = No Data Reported; -- = Not Applicable; NA = Not Available; W = Withheld to avoid disclosure of individual company data. |
| Release Date: 6/1/2022 |
| Next Release Date: TBD |