|
Download Data (XLS File) |
|
||||||||
|
||||||||
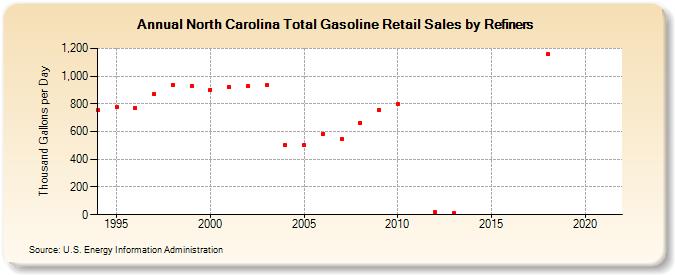
| North Carolina Total Gasoline Retail Sales by Refiners (Thousand Gallons per Day) | ||||||||
| Decade | Year-0 | Year-1 | Year-2 | Year-3 | Year-4 | Year-5 | Year-6 | Year-7 | Year-8 | Year-9 |
|---|---|---|---|---|---|---|---|---|---|---|
| 1990's | 754.7 | 775.2 | 771.5 | 869.6 | 939.3 | 931.1 | ||||
| 2000's | 903.2 | 924.6 | 925.3 | 932.6 | 501.1 | 500.8 | 583.0 | 549.1 | 665.2 | 756.7 |
| 2010's | 798.7 | W | 17.4 | 11.3 | W | W | W | W | 1,156.5 | W |
| 2020's | W |
| - = No Data Reported; -- = Not Applicable; NA = Not Available; W = Withheld to avoid disclosure of individual company data. |
| Release Date: 6/1/2022 |
| Next Release Date: TBD |