|
Download Data (XLS File) |
|
||||||||
|
||||||||
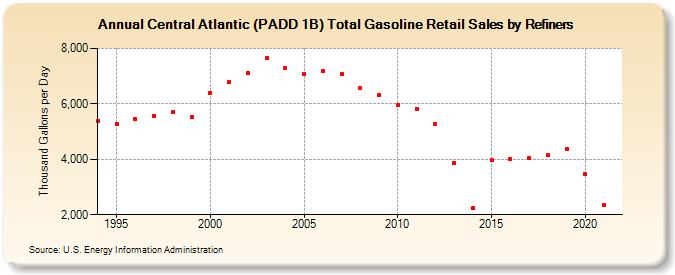
| Central Atlantic (PADD 1B) Total Gasoline Retail Sales by Refiners (Thousand Gallons per Day) | ||||||||
| Decade | Year-0 | Year-1 | Year-2 | Year-3 | Year-4 | Year-5 | Year-6 | Year-7 | Year-8 | Year-9 |
|---|---|---|---|---|---|---|---|---|---|---|
| 1990's | 5,388.3 | 5,287.8 | 5,444.4 | 5,553.2 | 5,697.2 | 5,521.1 | ||||
| 2000's | 6,396.1 | 6,795.3 | 7,113.6 | 7,645.5 | 7,275.8 | 7,090.4 | 7,185.8 | 7,091.7 | 6,568.9 | 6,329.6 |
| 2010's | 5,955.0 | 5,823.9 | 5,266.0 | 3,862.4 | 2,225.4 | 3,987.0 | 3,996.1 | 4,035.1 | 4,138.1 | 4,364.5 |
| 2020's | 3,455.7 |
| - = No Data Reported; -- = Not Applicable; NA = Not Available; W = Withheld to avoid disclosure of individual company data. |
| Release Date: 6/1/2022 |
| Next Release Date: TBD |