|
Download Data (XLS File) |
|
||||||||
|
||||||||
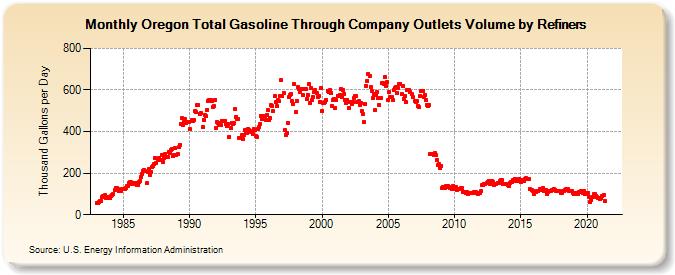
| Oregon Total Gasoline Through Company Outlets Volume by Refiners (Thousand Gallons per Day) | ||||||||
| Year | Jan | Feb | Mar | Apr | May | Jun | Jul | Aug | Sep | Oct | Nov | Dec |
|---|---|---|---|---|---|---|---|---|---|---|---|---|
| 1983 | 58.4 | 56.7 | 61.7 | 65.1 | 66.7 | 86.1 | 89.8 | 93.1 | 82.3 | 81.0 | 83.6 | 79.5 |
| 1984 | 80.3 | 90.3 | 94.8 | 98.8 | 116.7 | 129.2 | 126.6 | 124.7 | 115.2 | 113.7 | 113.5 | 122.6 |
| 1985 | 124.3 | 123.4 | 127.6 | 136.4 | 137.3 | 150.5 | 155.3 | 155.3 | 148.7 | 153.2 | 146.6 | 153.7 |
| 1986 | 144.9 | 141.7 | 158.3 | 161.6 | 179.5 | 197.4 | 210.9 | 216.3 | 209.5 | 150.3 | 206.2 | 217.8 |
| 1987 | 192.3 | 206.3 | 230.5 | 233.5 | 242.2 | 273.4 | 249.2 | 263.4 | 270.6 | 262.5 | 263.0 | 287.7 |
| 1988 | 254.1 | 270.6 | 292.1 | 278.2 | 275.2 | 303.6 | 298.9 | 309.5 | 313.9 | 282.6 | 285.6 | 319.1 |
| 1989 | 285.4 | 291.5 | 323.3 | 336.9 | 437.0 | 463.7 | 430.5 | 447.8 | 458.1 | 440.1 | 444.3 | 446.1 |
| 1990 | 411.3 | W | 455.7 | 452.8 | 453.2 | 498.7 | 494.9 | 525.9 | 526.7 | 486.8 | 488.5 | W |
| 1991 | 421.5 | 456.2 | 479.5 | 472.5 | 504.3 | 548.6 | 550.2 | 552.6 | 545.0 | 520.0 | 521.4 | 553.2 |
| 1992 | 415.7 | 444.8 | 442.4 | 429.7 | 431.5 | 451.2 | 450.0 | 452.5 | 452.6 | 437.3 | 427.8 | 436.7 |
| 1993 | 375.2 | 416.8 | 440.0 | 434.6 | 440.3 | 507.0 | 472.2 | 462.3 | 462.3 | 370.9 | 369.2 | 381.3 |
| 1994 | 364.5 | 385.4 | 406.1 | 403.1 | 391.0 | 411.8 | 409.6 | 402.2 | 399.9 | 386.1 | 411.8 | 408.8 |
| 1995 | 377.5 | 373.8 | 414.4 | 424.0 | 437.2 | 476.3 | 461.4 | 473.2 | 476.4 | 457.5 | 478.2 | 502.4 |
| 1996 | 454.9 | 465.4 | 525.6 | 524.0 | 496.6 | 569.1 | 540.4 | 520.5 | 549.4 | 545.6 | 573.3 | 646.3 |
| 1997 | 569.4 | 587.3 | 405.7 | 384.1 | 394.6 | 442.1 | 564.4 | 577.7 | 580.1 | 546.7 | 533.5 | 627.8 |
| 1998 | 494.8 | 549.1 | 612.1 | 605.9 | 592.5 | 605.5 | 606.5 | 574.7 | 606.3 | 604.3 | 554.8 | 577.3 |
| 1999 | 629.7 | 535.7 | 609.1 | 549.5 | 568.5 | 592.0 | 598.4 | 586.7 | 568.1 | 569.2 | 544.1 | 611.3 |
| 2000 | 499.5 | 539.6 | 537.7 | 544.2 | 550.5 | 596.5 | 589.1 | 598.2 | 585.0 | 524.7 | 554.1 | 557.9 |
| 2001 | 512.4 | 551.0 | 572.5 | 570.9 | 576.0 | 604.4 | 565.4 | 599.3 | 580.3 | 551.3 | 536.6 | 552.4 |
| 2002 | 514.6 | 543.3 | 542.0 | 532.2 | 540.1 | 562.9 | 569.6 | 571.1 | 544.2 | 545.7 | 528.0 | 539.2 |
| 2003 | 496.8 | 483.1 | 445.6 | 534.4 | 620.4 | 643.6 | 677.1 | 667.1 | 616.6 | 596.4 | 559.5 | 580.6 |
| 2004 | 501.4 | 575.6 | 587.9 | 561.2 | 528.6 | 562.8 | 631.9 | 634.4 | 628.9 | 662.5 | 618.4 | 636.2 |
| 2005 | 550.6 | 590.8 | 565.3 | 565.3 | 552.7 | 600.0 | 609.8 | 615.4 | 586.6 | 608.8 | 629.6 | 628.8 |
| 2006 | 578.8 | 617.4 | 558.1 | 568.9 | 539.9 | 601.2 | 601.5 | 601.0 | 591.9 | 582.7 | 564.4 | W |
| 2007 | 546.7 | 542.4 | 545.0 | 524.3 | 515.8 | 571.0 | 593.0 | 597.0 | 568.0 | 577.4 | 550.6 | 529.4 |
| 2008 | 520.8 | 526.3 | 290.8 | 290.6 | 290.5 | 289.6 | 294.9 | 285.9 | 265.0 | 238.2 | 242.1 | 225.1 |
| 2009 | 235.5 | 129.3 | 134.4 | 129.5 | 137.0 | 135.2 | 138.9 | 134.6 | 128.4 | 127.8 | 124.5 | 139.2 |
| 2010 | 121.5 | 131.2 | 121.2 | 125.1 | 123.8 | 125.0 | 126.8 | 126.1 | 111.6 | 109.2 | 105.2 | 109.5 |
| 2011 | 99.4 | 106.1 | 103.8 | 104.8 | 102.6 | 106.6 | 107.9 | 107.1 | 102.9 | 101.5 | 103.0 | 104.4 |
| 2012 | 113.3 | 140.9 | 141.4 | 146.6 | 149.1 | 151.9 | 157.5 | 163.1 | 149.8 | 151.8 | 161.0 | 155.8 |
| 2013 | 141.4 | 148.5 | 149.7 | 154.2 | 154.7 | 160.2 | 167.7 | 165.5 | 145.4 | 146.4 | 149.7 | 148.7 |
| 2014 | 141.0 | 138.3 | 151.0 | 157.8 | 157.5 | 165.6 | 165.6 | 171.2 | 160.7 | 163.1 | 170.3 | 162.6 |
| 2015 | 158.2 | 167.1 | 160.2 | 164.1 | 171.6 | 174.5 | 174.1 | 169.5 | 122.3 | NA | 116.6 | 115.5 |
| 2016 | 101.7 | 109.2 | 107.9 | 116.4 | 113.1 | 123.3 | 118.9 | 122.2 | 128.5 | 116.2 | 112.4 | 118.1 |
| 2017 | 98.1 | 110.1 | 111.8 | 112.4 | 118.1 | 120.8 | 124.5 | 120.9 | 113.9 | 115.3 | 113.1 | 113.5 |
| 2018 | 105.7 | 102.9 | 111.9 | 114.8 | 117.1 | 122.4 | 124.2 | 121.5 | 115.9 | 115.0 | 113.7 | 105.9 |
| 2019 | 97.7 | 99.7 | 104.3 | 103.8 | 101.4 | 110.2 | 110.7 | 112.2 | 106.1 | 112.4 | 98.3 | 105.8 |
| 2020 | 100.1 | 106.0 | 84.6 | 58.9 | 70.7 | 87.0 | 98.1 | 98.1 | 88.2 | 86.2 | 78.5 | 80.5 |
| 2021 | 77.2 | 80.9 | 89.8 | 94.5 | 68.1 | W | W | W | W | W | W | W |
| 2022 | W | W | W | |||||||||
| - = No Data Reported; -- = Not Applicable; NA = Not Available; W = Withheld to avoid disclosure of individual company data. |
| Release Date: 6/1/2022 |
| Next Release Date: TBD |