|
Download Data (XLS File) |
|
||||||||
|
||||||||
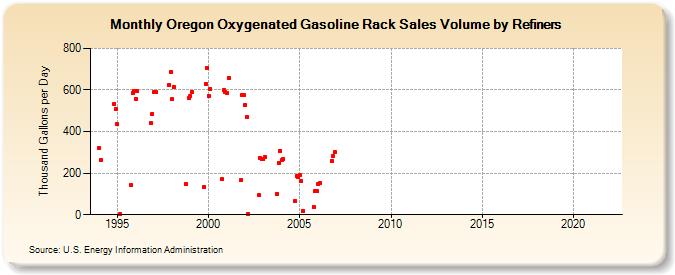
| Oregon Oxygenated Gasoline Rack Sales Volume by Refiners (Thousand Gallons per Day) | ||||||||
| Year | Jan | Feb | Mar | Apr | May | Jun | Jul | Aug | Sep | Oct | Nov | Dec |
|---|---|---|---|---|---|---|---|---|---|---|---|---|
| 1994 | 323.2 | 264.7 | W | W | - | - | - | - | - | W | 532.4 | 508.4 |
| 1995 | 434.3 | W | 3.0 | - | - | - | - | - | - | 143.3 | 584.6 | 596.2 |
| 1996 | 557.1 | 594.0 | - | - | - | - | - | - | - | W | 439.6 | 485.1 |
| 1997 | 589.5 | 591.8 | - | W | W | W | W | W | W | NA | 623.3 | 687.0 |
| 1998 | 555.2 | 616.6 | W | W | W | W | W | W | W | 149.5 | W | 560.9 |
| 1999 | 571.2 | 587.9 | W | - | - | - | - | - | - | 134.4 | 630.3 | 707.8 |
| 2000 | 572.8 | 604.7 | W | W | W | W | W | W | W | 171.2 | 600.7 | 590.8 |
| 2001 | 583.8 | 657.6 | W | - | W | - | - | - | - | 165.2 | 574.7 | 574.4 |
| 2002 | 527.5 | 469.6 | 3.9 | W | - | W | NA | W | NA | 94.1 | 271.0 | 267.5 |
| 2003 | 266.4 | 276.0 | W | W | - | W | W | W | W | 100.1 | 250.5 | 308.4 |
| 2004 | 261.3 | 267.6 | W | W | W | W | W | W | NA | 67.5 | 184.2 | 182.0 |
| 2005 | 191.3 | 162.1 | 18.5 | W | W | W | W | W | W | 38.5 | 112.5 | 112.1 |
| 2006 | 147.7 | 151.2 | W | W | W | - | - | - | - | 259.8 | 283.2 | 299.9 |
| 2007 | - | - | - | - | - | - | - | - | - | - | - | - |
| 2008 | - | - | - | - | - | - | - | - | - | - | - | - |
| 2009 | - | - | - | - | - | - | - | - | - | - | - | - |
| 2010 | - | - | - | - | - | - | - | - | - | - | - | - |
| 2011 | - | - | - | - | - | - | - | - | - | - | - | - |
| 2012 | - | - | - | - | - | - | - | - | - | - | - | - |
| 2013 | - | - | - | - | - | - | - | - | - | - | - | - |
| 2014 | - | - | - | - | - | - | - | - | - | - | - | - |
| 2015 | - | - | - | - | - | - | - | - | - | - | - | - |
| 2016 | - | - | - | - | - | - | - | - | - | - | - | - |
| 2017 | - | - | - | - | - | - | - | - | - | - | - | - |
| 2018 | - | - | - | - | - | - | - | - | - | - | - | - |
| 2019 | - | - | - | - | - | - | - | - | - | - | - | - |
| 2020 | - | - | - | - | - | - | - | - | - | - | - | - |
| 2021 | - | - | - | - | - | - | - | - | - | - | - | - |
| 2022 | - | - | - | |||||||||
| - = No Data Reported; -- = Not Applicable; NA = Not Available; W = Withheld to avoid disclosure of individual company data. |
| Release Date: 6/1/2022 |
| Next Release Date: TBD |