|
Download Data (XLS File) |
|
||||||||
|
||||||||
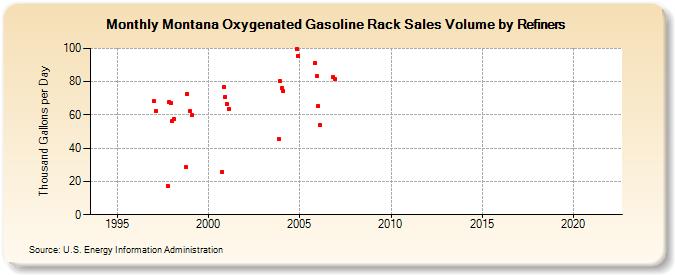
| Montana Oxygenated Gasoline Rack Sales Volume by Refiners (Thousand Gallons per Day) | ||||||||
| Year | Jan | Feb | Mar | Apr | May | Jun | Jul | Aug | Sep | Oct | Nov | Dec |
|---|---|---|---|---|---|---|---|---|---|---|---|---|
| 1994 | W | W | - | - | - | - | - | - | - | W | W | W |
| 1995 | W | W | - | - | - | - | - | - | - | W | W | W |
| 1996 | W | W | - | - | - | - | - | - | - | W | W | W |
| 1997 | 68.2 | 62.5 | - | - | - | - | - | - | - | 17.5 | 67.7 | 67.1 |
| 1998 | 56.2 | 57.7 | - | - | - | - | - | - | - | 28.5 | 72.6 | W |
| 1999 | 62.1 | 59.8 | NA | - | - | - | - | - | - | W | W | W |
| 2000 | W | W | - | - | - | - | - | - | - | 25.9 | 76.7 | 70.8 |
| 2001 | 66.8 | 63.8 | - | - | - | - | - | - | - | W | W | W |
| 2002 | W | W | - | - | - | - | - | - | - | W | W | W |
| 2003 | W | W | - | - | - | - | - | - | - | W | 45.6 | 80.3 |
| 2004 | 76.0 | 74.1 | - | - | - | - | - | - | - | W | 99.7 | 95.6 |
| 2005 | W | W | - | - | - | - | - | - | - | W | 91.1 | 83.2 |
| 2006 | 65.5 | 53.8 | - | - | - | - | - | - | - | W | 82.8 | 81.5 |
| 2007 | - | - | - | - | - | - | - | - | - | - | - | - |
| 2008 | - | - | - | - | - | - | - | - | - | - | - | - |
| 2009 | - | - | - | - | - | - | - | - | - | - | - | - |
| 2010 | - | - | - | - | - | - | - | - | - | - | - | - |
| 2011 | - | - | - | - | - | - | - | - | - | - | - | - |
| 2012 | - | - | - | - | - | - | - | - | - | - | - | - |
| 2013 | - | - | - | - | - | - | - | - | - | - | - | - |
| 2014 | - | - | - | - | - | - | - | - | - | - | - | - |
| 2015 | - | - | - | - | - | - | - | - | - | - | - | - |
| 2016 | - | - | - | - | - | - | - | - | - | - | - | - |
| 2017 | - | - | - | - | - | - | - | - | - | - | - | - |
| 2018 | - | - | - | - | - | - | - | - | - | - | - | - |
| 2019 | - | - | - | - | - | - | - | - | - | - | - | - |
| 2020 | - | - | - | - | - | - | - | - | - | - | - | - |
| 2021 | - | - | - | - | - | - | - | - | - | - | - | - |
| 2022 | - | - | - | |||||||||
| - = No Data Reported; -- = Not Applicable; NA = Not Available; W = Withheld to avoid disclosure of individual company data. |
| Release Date: 6/1/2022 |
| Next Release Date: TBD |