|
Download Data (XLS File) |
|
||||||||
|
||||||||
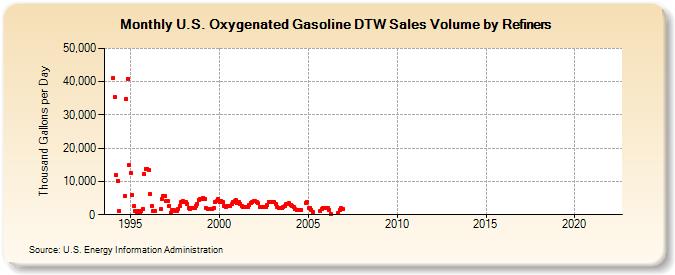
| U.S. Oxygenated Gasoline DTW Sales Volume by Refiners (Thousand Gallons per Day) | ||||||||
| Year | Jan | Feb | Mar | Apr | May | Jun | Jul | Aug | Sep | Oct | Nov | Dec |
|---|---|---|---|---|---|---|---|---|---|---|---|---|
| 1994 | 41,173.3 | 35,429.4 | 11,977.2 | 10,272.2 | 1,256.0 | W | W | W | 5,556.6 | 34,849.4 | 40,873.8 | 14,937.5 |
| 1995 | 12,658.5 | 5,951.6 | 2,619.4 | 980.8 | 957.5 | 990.8 | 962.8 | 993.2 | 1,813.7 | 12,240.6 | 13,854.0 | 13,834.4 |
| 1996 | 13,456.3 | 6,239.1 | 2,589.4 | 1,049.5 | 1,005.5 | NA | NA | NA | 1,750.5 | 4,585.6 | 5,489.0 | 5,552.3 |
| 1997 | 4,062.8 | 4,025.8 | 2,622.6 | 652.4 | 1,284.0 | 1,317.8 | 1,251.8 | 1,254.3 | 1,698.6 | 2,734.5 | 3,899.3 | 4,075.2 |
| 1998 | 3,780.0 | 3,674.9 | 3,243.6 | 1,880.2 | 1,824.9 | 1,897.6 | 2,005.6 | 2,050.6 | 2,723.6 | 3,346.7 | 4,456.9 | 4,686.0 |
| 1999 | 4,696.8 | 5,137.3 | 4,711.1 | 1,997.5 | 1,570.1 | 1,634.3 | 1,688.2 | 1,615.0 | 2,089.4 | 3,845.0 | 4,248.2 | 4,733.4 |
| 2000 | 3,843.4 | 4,185.3 | 3,760.4 | 2,718.0 | 2,391.0 | 2,570.9 | 2,512.4 | 2,591.2 | 3,110.6 | 3,959.9 | 4,210.0 | 4,290.9 |
| 2001 | 3,555.1 | 3,921.3 | 3,272.5 | 2,567.1 | 2,238.2 | 2,247.2 | 2,211.8 | 2,346.6 | 2,801.3 | 3,661.6 | 3,901.4 | 4,022.8 |
| 2002 | 4,017.5 | 3,828.9 | 3,428.5 | 2,468.6 | 2,204.4 | 2,244.0 | 2,195.3 | 2,256.6 | 2,818.6 | 3,969.5 | 3,927.8 | 3,918.4 |
| 2003 | 3,875.5 | 3,811.0 | 3,168.6 | 2,172.3 | 2,018.7 | 2,094.8 | 2,080.6 | 2,190.2 | 2,610.3 | 3,146.6 | 3,311.2 | 3,437.5 |
| 2004 | 2,993.0 | 2,731.2 | 2,374.5 | 1,574.6 | 1,367.8 | 1,324.8 | 1,408.8 | 1,384.2 | NA | NA | 3,651.4 | 3,803.2 |
| 2005 | 1,986.8 | 2,044.3 | 1,502.9 | 801.4 | W | W | W | W | 1,127.1 | 1,744.5 | 1,933.7 | 1,968.3 |
| 2006 | 1,904.6 | 1,883.0 | 1,421.0 | 327.0 | - | - | - | - | 369.6 | 1,284.3 | 1,868.7 | 1,865.8 |
| 2007 | - | - | - | - | - | - | - | - | - | - | - | - |
| 2008 | - | - | - | - | - | - | - | - | - | - | - | - |
| 2009 | - | - | - | - | - | - | - | - | - | - | - | - |
| 2010 | - | - | - | - | - | - | - | - | - | - | - | - |
| 2011 | - | - | - | - | - | - | - | - | - | - | - | - |
| 2012 | - | - | - | - | - | - | - | - | - | - | - | - |
| 2013 | - | - | - | - | - | - | - | - | - | - | - | - |
| 2014 | - | - | - | - | - | - | - | - | - | - | - | - |
| 2015 | - | - | - | - | - | - | - | - | - | - | - | - |
| 2016 | - | - | - | - | - | - | - | - | - | - | - | - |
| 2017 | - | - | - | - | - | - | - | - | - | - | - | - |
| 2018 | - | - | - | - | - | - | - | - | - | - | - | - |
| 2019 | - | - | - | - | - | - | - | - | - | - | - | - |
| 2020 | - | - | - | - | - | - | - | - | - | - | - | - |
| 2021 | - | - | - | - | - | - | - | - | - | - | - | - |
| 2022 | - | - | - | |||||||||
| - = No Data Reported; -- = Not Applicable; NA = Not Available; W = Withheld to avoid disclosure of individual company data. |
| Release Date: 6/1/2022 |
| Next Release Date: TBD |