|
Download Data (XLS File) |
|
||||||||
|
||||||||
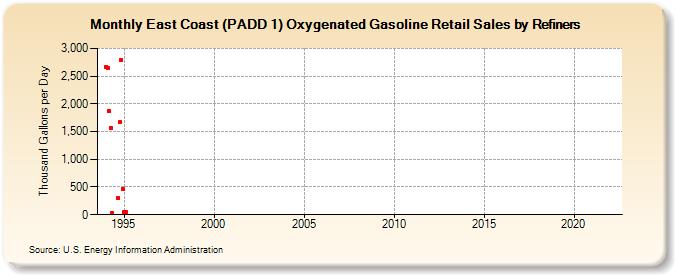
| East Coast (PADD 1) Oxygenated Gasoline Retail Sales by Refiners (Thousand Gallons per Day) | ||||||||
| Year | Jan | Feb | Mar | Apr | May | Jun | Jul | Aug | Sep | Oct | Nov | Dec |
|---|---|---|---|---|---|---|---|---|---|---|---|---|
| 1994 | 2,672.5 | 2,648.9 | 1,878.3 | 1,569.5 | 23.7 | W | - | W | 302.8 | 1,669.2 | 2,791.3 | 456.4 |
| 1995 | 55.4 | 56.9 | - | - | - | - | - | - | - | - | - | - |
| 1996 | - | - | - | - | - | - | - | - | - | - | - | - |
| 1997 | - | - | - | - | - | - | - | - | - | - | - | - |
| 1998 | - | - | - | - | - | - | - | - | - | - | - | - |
| 1999 | - | - | - | - | - | - | - | - | - | - | - | - |
| 2000 | - | - | - | - | - | - | - | - | - | - | - | - |
| 2001 | - | - | - | - | - | - | - | - | - | - | - | - |
| 2002 | - | - | - | - | - | - | - | - | - | - | - | - |
| 2003 | - | - | - | - | - | - | - | - | - | - | - | - |
| 2004 | - | - | - | - | - | - | - | - | - | - | - | - |
| 2005 | - | - | - | - | - | - | - | - | - | - | - | - |
| 2006 | - | - | - | - | - | - | - | - | - | - | - | - |
| 2007 | - | - | - | - | - | - | - | - | - | - | - | - |
| 2008 | - | - | - | - | - | - | - | - | - | - | - | - |
| 2009 | - | - | - | - | - | - | - | - | - | - | - | - |
| 2010 | - | - | - | - | - | - | - | - | - | - | - | - |
| 2011 | - | - | - | - | - | - | - | - | - | - | - | - |
| 2012 | - | - | - | - | - | - | - | - | - | - | - | - |
| 2013 | - | - | - | - | - | - | - | - | - | - | - | - |
| 2014 | - | - | - | - | - | - | - | - | - | - | - | - |
| 2015 | - | - | - | - | - | - | - | - | - | - | - | - |
| 2016 | - | - | - | - | - | - | - | - | - | - | - | - |
| 2017 | - | - | - | - | - | - | - | - | - | - | - | - |
| 2018 | - | - | - | - | - | - | - | - | - | - | - | - |
| 2019 | - | - | - | - | - | - | - | - | - | - | - | - |
| 2020 | - | - | - | - | - | - | - | - | - | - | - | - |
| 2021 | - | - | - | - | - | - | - | - | - | - | - | - |
| 2022 | - | - | - | |||||||||
| - = No Data Reported; -- = Not Applicable; NA = Not Available; W = Withheld to avoid disclosure of individual company data. |
| Release Date: 6/1/2022 |
| Next Release Date: TBD |