|
Download Data (XLS File) |
|
||||||||
|
||||||||
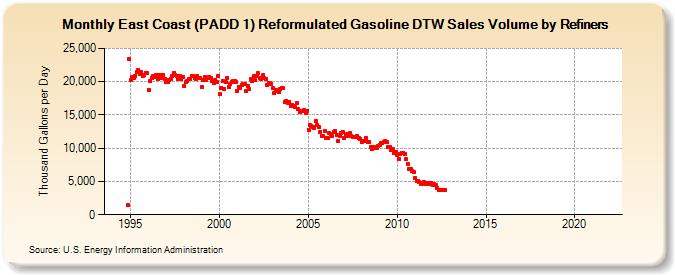
| East Coast (PADD 1) Reformulated Gasoline DTW Sales Volume by Refiners (Thousand Gallons per Day) | ||||||||
| Year | Jan | Feb | Mar | Apr | May | Jun | Jul | Aug | Sep | Oct | Nov | Dec |
|---|---|---|---|---|---|---|---|---|---|---|---|---|
| 1994 | - | - | - | - | - | - | - | - | - | - | 1,390.9 | 23,417.4 |
| 1995 | 20,188.0 | 20,746.9 | 20,619.4 | 20,919.8 | 21,379.1 | 21,765.3 | 21,175.3 | 21,475.4 | 20,853.1 | 20,961.5 | 21,348.7 | 21,300.0 |
| 1996 | 18,723.1 | 20,134.2 | 20,605.6 | 20,787.2 | 20,765.2 | 20,987.6 | 20,330.7 | 21,037.8 | 20,593.7 | 21,006.8 | 20,999.0 | 20,430.1 |
| 1997 | 19,956.9 | 20,009.3 | 20,257.3 | 20,423.1 | 20,878.3 | 21,344.8 | 20,962.7 | 20,864.3 | 20,358.0 | 20,854.0 | 20,463.7 | 20,737.1 |
| 1998 | 19,284.8 | 19,874.4 | 20,162.0 | 20,381.3 | 20,367.2 | 20,906.4 | 20,866.6 | 20,526.6 | 20,438.2 | 20,898.4 | 20,573.3 | 20,533.5 |
| 1999 | 19,213.6 | 20,253.8 | 20,640.0 | 20,226.2 | 20,514.8 | 20,710.4 | 20,529.7 | 20,080.2 | 19,841.6 | 20,322.6 | 19,997.4 | 20,822.8 |
| 2000 | 18,069.8 | 19,085.4 | 20,100.2 | 18,941.8 | 19,897.1 | 20,593.7 | 19,193.9 | 19,652.7 | 19,992.5 | 20,068.0 | 20,064.1 | 19,909.3 |
| 2001 | 18,578.6 | 19,220.5 | 19,116.9 | 19,490.0 | 19,668.3 | 19,629.2 | 18,547.4 | 19,380.8 | 18,859.3 | 20,339.5 | 20,128.2 | 20,805.6 |
| 2002 | 20,242.5 | 20,911.7 | 21,234.3 | 20,518.8 | 20,444.2 | 20,977.3 | 20,583.2 | 20,413.8 | 19,529.9 | 19,811.3 | 19,829.7 | 19,604.6 |
| 2003 | 18,999.3 | 18,239.3 | 18,685.8 | 18,659.5 | 18,419.6 | 18,887.8 | 19,119.8 | 19,001.8 | 16,889.2 | 17,126.9 | 16,790.6 | 17,001.4 |
| 2004 | 16,373.1 | 16,509.2 | 16,389.8 | 16,134.4 | 16,757.1 | 15,921.0 | 15,467.8 | 15,586.5 | 15,590.9 | 15,756.3 | 15,263.3 | 15,581.8 |
| 2005 | 12,769.3 | 13,435.1 | 13,329.1 | 13,210.6 | 13,095.5 | 14,056.4 | 13,458.6 | 13,197.4 | 12,484.4 | 11,893.8 | 11,898.5 | 12,592.2 |
| 2006 | 11,556.4 | 11,470.2 | 12,232.6 | 12,152.9 | 11,799.6 | 12,396.9 | 12,522.9 | 11,941.9 | 11,034.3 | 11,896.7 | 12,310.0 | 12,502.1 |
| 2007 | 11,524.7 | 12,051.3 | 12,094.3 | 11,847.6 | 12,242.1 | 11,872.5 | 11,670.9 | 11,753.9 | 11,637.0 | 11,852.1 | 11,521.0 | 11,368.4 |
| 2008 | 10,996.8 | 11,102.6 | 11,119.2 | 11,498.8 | 10,866.5 | 10,903.0 | 10,174.1 | 9,856.8 | 10,181.2 | 10,098.0 | 10,068.0 | 10,329.7 |
| 2009 | 10,550.5 | 10,741.9 | 10,743.2 | 10,854.8 | 11,062.6 | 10,862.3 | 10,242.6 | 10,194.2 | 9,715.2 | 9,805.3 | 9,323.8 | 9,424.3 |
| 2010 | 8,948.0 | 8,432.0 | 9,189.5 | 9,301.0 | 9,287.4 | 9,124.7 | 8,323.0 | 7,667.5 | 6,914.4 | 6,861.7 | 6,632.8 | 6,418.3 |
| 2011 | 5,569.7 | 5,104.0 | 5,006.5 | 4,854.8 | 4,667.5 | 4,817.6 | 4,879.9 | 4,588.5 | 4,588.0 | 4,695.6 | 4,623.0 | 4,739.0 |
| 2012 | 4,512.6 | 4,588.9 | 4,488.8 | 4,064.1 | 3,658.6 | 3,746.9 | 3,751.6 | 3,706.0 | 3,652.9 | W | W | W |
| 2013 | W | W | W | W | W | W | W | W | W | W | W | W |
| 2014 | W | W | W | W | W | W | W | W | W | W | W | W |
| 2015 | W | W | W | W | W | W | W | W | W | W | W | W |
| 2016 | W | W | W | W | W | W | W | W | W | W | W | W |
| 2017 | W | W | W | W | W | W | W | W | W | W | W | W |
| 2018 | W | W | W | W | W | W | W | W | W | W | W | W |
| 2019 | W | W | W | W | W | W | W | W | W | W | W | W |
| 2020 | W | W | W | W | W | W | W | W | W | W | W | NA |
| 2021 | W | W | W | W | W | W | W | W | W | NA | W | W |
| 2022 | W | W | W | |||||||||
| - = No Data Reported; -- = Not Applicable; NA = Not Available; W = Withheld to avoid disclosure of individual company data. |
| Release Date: 6/1/2022 |
| Next Release Date: TBD |