|
Download Data (XLS File) |
|
||||||||
|
||||||||
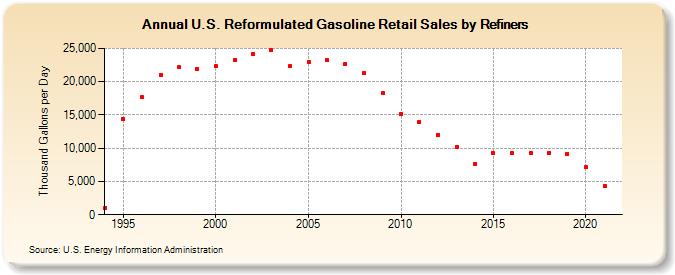
| U.S. Reformulated Gasoline Retail Sales by Refiners (Thousand Gallons per Day) | ||||||||
| Decade | Year-0 | Year-1 | Year-2 | Year-3 | Year-4 | Year-5 | Year-6 | Year-7 | Year-8 | Year-9 |
|---|---|---|---|---|---|---|---|---|---|---|
| 1990's | 1,039.8 | 14,358.6 | 17,647.6 | 20,971.1 | 22,162.1 | 21,956.0 | ||||
| 2000's | 22,350.9 | 23,282.0 | 24,112.6 | 24,701.9 | 22,290.9 | 22,887.0 | 23,205.9 | 22,687.0 | 21,255.1 | 18,284.3 |
| 2010's | 15,197.9 | 13,937.3 | 12,030.0 | 10,195.2 | 7,675.9 | 9,224.6 | 9,238.4 | 9,204.1 | 9,278.8 | 9,128.2 |
| 2020's | 7,121.3 |
| - = No Data Reported; -- = Not Applicable; NA = Not Available; W = Withheld to avoid disclosure of individual company data. |
| Release Date: 6/1/2022 |
| Next Release Date: TBD |