|
Download Data (XLS File) |
|
||||||||
|
||||||||
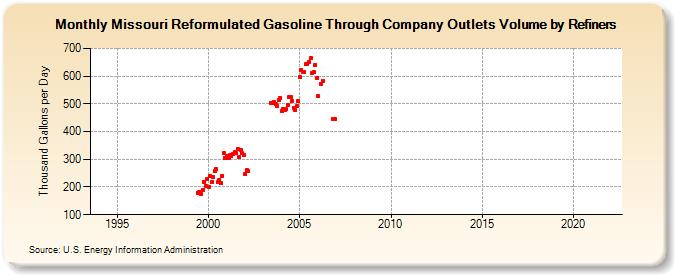
| Missouri Reformulated Gasoline Through Company Outlets Volume by Refiners (Thousand Gallons per Day) | ||||||||
| Year | Jan | Feb | Mar | Apr | May | Jun | Jul | Aug | Sep | Oct | Nov | Dec |
|---|---|---|---|---|---|---|---|---|---|---|---|---|
| 1994 | - | - | - | - | - | - | - | - | - | - | - | - |
| 1995 | - | - | - | - | - | - | - | - | - | - | - | - |
| 1996 | - | - | - | - | - | - | - | - | - | - | - | - |
| 1997 | - | - | - | - | - | - | - | - | - | - | - | - |
| 1998 | - | - | - | - | - | - | - | - | - | - | - | - |
| 1999 | - | - | - | W | W | 179.3 | 183.7 | 174.3 | 190.9 | 216.3 | 204.6 | 227.7 |
| 2000 | 201.0 | 240.0 | 217.7 | 235.2 | 257.3 | 263.5 | 218.7 | 225.1 | 212.9 | 241.0 | 321.7 | 305.4 |
| 2001 | 310.5 | 305.3 | 315.5 | 312.5 | 320.5 | 327.0 | 323.5 | 336.7 | 307.8 | 332.7 | 320.9 | 315.8 |
| 2002 | 248.2 | 261.3 | 256.3 | W | W | W | W | W | W | W | W | W |
| 2003 | W | W | W | W | W | 503.6 | 501.2 | 505.5 | 500.8 | 492.5 | 512.3 | 521.0 |
| 2004 | 474.6 | 480.3 | 476.6 | 480.9 | 495.5 | 523.7 | 523.2 | 511.2 | 485.2 | 477.4 | 490.6 | 509.4 |
| 2005 | 595.7 | 621.7 | 615.9 | 614.0 | 642.6 | 643.1 | 649.8 | 664.3 | 611.1 | 615.6 | 640.5 | 593.0 |
| 2006 | 527.2 | W | 571.5 | 581.7 | W | W | W | W | W | W | 444.0 | 445.2 |
| 2007 | W | W | W | W | W | W | W | W | W | W | W | W |
| 2008 | W | W | W | W | W | W | W | W | W | W | W | W |
| 2009 | W | W | W | W | W | W | W | W | W | W | W | W |
| 2010 | W | W | W | W | W | W | W | W | W | W | W | W |
| 2011 | W | W | W | W | W | W | W | W | W | - | - | - |
| 2012 | - | - | - | - | - | - | - | - | - | - | - | - |
| 2013 | - | - | - | - | - | - | - | - | - | - | - | - |
| 2014 | - | - | - | - | - | - | - | - | - | - | - | - |
| 2015 | - | - | - | - | - | - | - | - | - | - | - | - |
| 2016 | - | - | - | - | - | - | - | - | - | - | - | - |
| 2017 | - | - | - | - | - | - | - | - | - | - | - | - |
| 2018 | - | - | - | - | - | - | - | - | - | - | - | - |
| 2019 | - | - | - | - | - | - | - | - | - | - | - | - |
| 2020 | - | - | - | - | - | - | - | - | - | - | - | - |
| 2021 | - | - | - | - | - | - | - | - | - | - | - | - |
| 2022 | - | - | - | |||||||||
| - = No Data Reported; -- = Not Applicable; NA = Not Available; W = Withheld to avoid disclosure of individual company data. |
| Release Date: 6/1/2022 |
| Next Release Date: TBD |