|
Download Data (XLS File) |
|
||||||||
|
||||||||
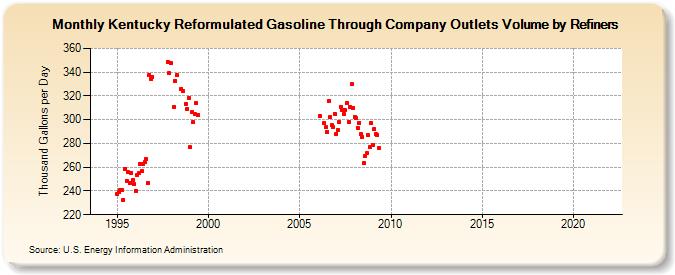
| Kentucky Reformulated Gasoline Through Company Outlets Volume by Refiners (Thousand Gallons per Day) | ||||||||
| Year | Jan | Feb | Mar | Apr | May | Jun | Jul | Aug | Sep | Oct | Nov | Dec |
|---|---|---|---|---|---|---|---|---|---|---|---|---|
| 1994 | - | - | - | - | - | - | - | - | - | - | - | W |
| 1995 | 237.2 | 238.9 | 241.2 | 240.4 | 232.7 | 258.9 | 248.6 | 255.6 | 246.9 | 255.2 | 248.8 | 245.8 |
| 1996 | 240.3 | 253.1 | 254.7 | 262.3 | 256.7 | 262.9 | 264.2 | 266.7 | 246.6 | 337.9 | 334.2 | 336.1 |
| 1997 | W | W | W | W | W | W | W | W | W | 348.8 | 339.0 | 347.6 |
| 1998 | W | 310.9 | 332.8 | 337.4 | W | W | 325.8 | 324.4 | W | 313.2 | 309.4 | 317.9 |
| 1999 | 276.6 | 306.1 | 297.7 | 304.7 | 313.8 | 304.1 | W | W | W | W | W | W |
| 2000 | W | W | W | W | W | W | W | W | W | W | W | W |
| 2001 | W | W | W | W | W | W | W | W | W | W | W | W |
| 2002 | W | W | W | W | W | W | W | W | W | W | W | W |
| 2003 | W | W | W | W | W | W | W | W | W | W | W | W |
| 2004 | W | W | W | W | W | W | W | W | W | W | W | W |
| 2005 | W | W | W | W | W | W | W | W | W | W | W | W |
| 2006 | W | 303.1 | W | W | 297.0 | 293.5 | 289.9 | 315.6 | 302.0 | 295.3 | 293.7 | 304.8 |
| 2007 | 288.2 | 290.9 | 297.8 | 311.0 | 308.5 | 304.6 | 308.0 | 314.1 | 298.2 | 311.0 | 329.7 | 310.2 |
| 2008 | 302.1 | 301.1 | 293.2 | 297.5 | 287.7 | 285.7 | 263.5 | 269.7 | 271.6 | 286.7 | 276.8 | 297.1 |
| 2009 | 278.6 | 291.8 | 287.6 | 287.0 | 275.9 | W | W | W | W | W | W | W |
| 2010 | W | W | W | W | W | W | W | W | W | W | W | W |
| 2011 | W | W | W | W | W | W | W | W | W | W | W | W |
| 2012 | W | W | W | W | W | W | W | W | W | W | W | W |
| 2013 | W | W | W | W | W | W | W | W | W | W | W | W |
| 2014 | W | W | W | W | W | W | W | W | W | W | W | W |
| 2015 | W | W | W | W | W | W | W | W | W | W | W | W |
| 2016 | W | W | W | W | W | W | W | W | W | W | W | W |
| 2017 | W | W | W | W | W | W | W | W | W | W | W | W |
| 2018 | W | W | W | W | W | W | W | W | W | W | W | W |
| 2019 | W | W | W | W | W | W | W | W | W | W | W | W |
| 2020 | W | W | W | W | W | W | W | W | W | W | W | W |
| 2021 | W | W | W | W | W | - | - | - | - | - | - | - |
| 2022 | W | W | W | |||||||||
| - = No Data Reported; -- = Not Applicable; NA = Not Available; W = Withheld to avoid disclosure of individual company data. |
| Release Date: 6/1/2022 |
| Next Release Date: TBD |