|
Download Data (XLS File) |
|
||||||||
|
||||||||
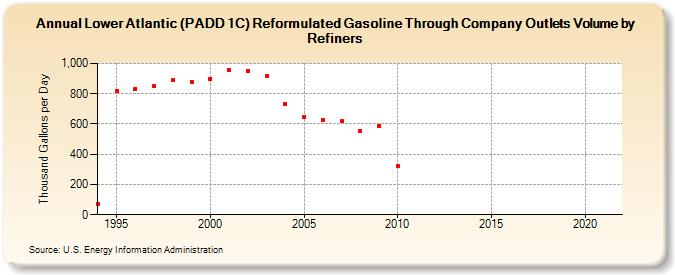
| Lower Atlantic (PADD 1C) Reformulated Gasoline Through Company Outlets Volume by Refiners (Thousand Gallons per Day) | ||||||||
| Decade | Year-0 | Year-1 | Year-2 | Year-3 | Year-4 | Year-5 | Year-6 | Year-7 | Year-8 | Year-9 |
|---|---|---|---|---|---|---|---|---|---|---|
| 1990's | 68.5 | 817.9 | 834.1 | 851.9 | 890.0 | 879.3 | ||||
| 2000's | 899.1 | 959.8 | 950.4 | 920.1 | 729.1 | 643.7 | 623.4 | 620.3 | 555.6 | 588.3 |
| 2010's | 322.9 | W | W | W | - | W | - | - | - | - |
| 2020's | - |
| - = No Data Reported; -- = Not Applicable; NA = Not Available; W = Withheld to avoid disclosure of individual company data. |
| Release Date: 6/1/2022 |
| Next Release Date: TBD |