|
Download Data (XLS File) |
|
||||||||
|
||||||||
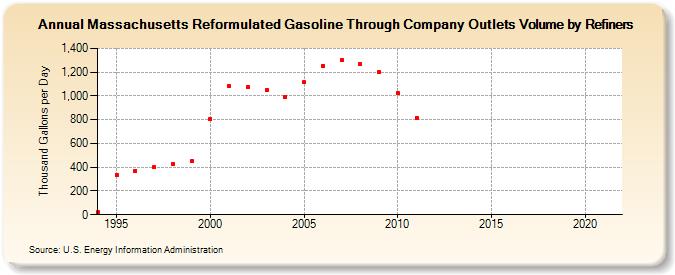
| Massachusetts Reformulated Gasoline Through Company Outlets Volume by Refiners (Thousand Gallons per Day) | ||||||||
| Decade | Year-0 | Year-1 | Year-2 | Year-3 | Year-4 | Year-5 | Year-6 | Year-7 | Year-8 | Year-9 |
|---|---|---|---|---|---|---|---|---|---|---|
| 1990's | 21.1 | 337.0 | 371.1 | 398.0 | 430.6 | 451.6 | ||||
| 2000's | 806.0 | 1,081.2 | 1,073.0 | 1,050.7 | 992.3 | 1,113.8 | 1,254.7 | 1,301.4 | 1,266.0 | 1,197.2 |
| 2010's | 1,021.9 | 816.5 | W | W | W | W | W | W | W | W |
| 2020's | W |
| - = No Data Reported; -- = Not Applicable; NA = Not Available; W = Withheld to avoid disclosure of individual company data. |
| Release Date: 6/1/2022 |
| Next Release Date: TBD |