|
Download Data (XLS File) |
|
||||||||
|
||||||||
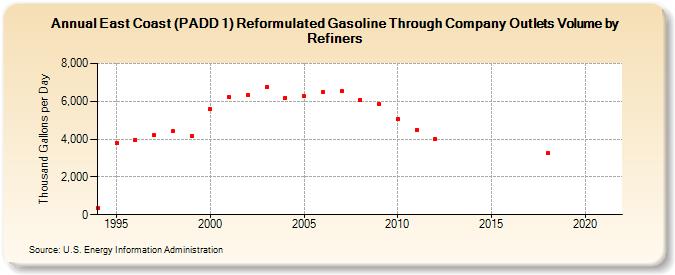
| East Coast (PADD 1) Reformulated Gasoline Through Company Outlets Volume by Refiners (Thousand Gallons per Day) | ||||||||
| Decade | Year-0 | Year-1 | Year-2 | Year-3 | Year-4 | Year-5 | Year-6 | Year-7 | Year-8 | Year-9 |
|---|---|---|---|---|---|---|---|---|---|---|
| 1990's | 357.3 | 3,797.9 | 3,978.1 | 4,195.3 | 4,407.6 | 4,155.7 | ||||
| 2000's | 5,568.0 | 6,202.7 | 6,318.5 | 6,754.8 | 6,190.6 | 6,255.7 | 6,473.5 | 6,542.5 | 6,086.3 | 5,842.2 |
| 2010's | 5,048.7 | 4,501.2 | 4,010.9 | W | W | W | W | W | 3,259.4 | W |
| 2020's | W |
| - = No Data Reported; -- = Not Applicable; NA = Not Available; W = Withheld to avoid disclosure of individual company data. |
| Release Date: 6/1/2022 |
| Next Release Date: TBD |