|
Download Data (XLS File) |
|
|||||
|
|||||
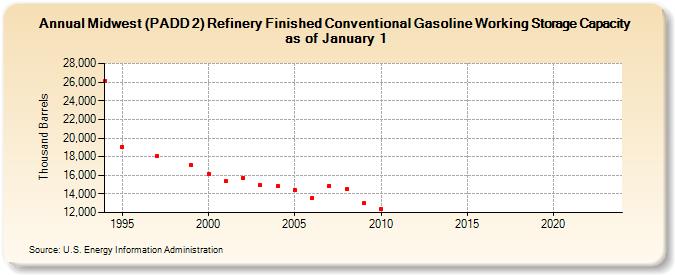
| Midwest (PADD 2) Refinery Finished Conventional Gasoline Working Storage Capacity as of January 1 (Thousand Barrels) | |||||
| Decade | Year-0 | Year-1 | Year-2 | Year-3 | Year-4 | Year-5 | Year-6 | Year-7 | Year-8 | Year-9 |
|---|---|---|---|---|---|---|---|---|---|---|
| 1990's | 26,130 | 19,067 | NA | 18,025 | NA | 17,060 | ||||
| 2000's | 16,157 | 15,336 | 15,753 | 14,961 | 14,873 | 14,392 | 13,612 | 14,891 | 14,516 | 12,974 |
| 2010's | 12,370 | -- | -- | -- | -- | -- | -- | -- | -- | -- |
| 2020's | -- | -- | -- | -- | -- |
| - = No Data Reported; -- = Not Applicable; NA = Not Available; W = Withheld to avoid disclosure of individual company data. |
| Release Date: 6/14/2024 |
| Next Release Date: June 2025 |