|
Download Data (XLS File) |
|
|||||
|
|||||
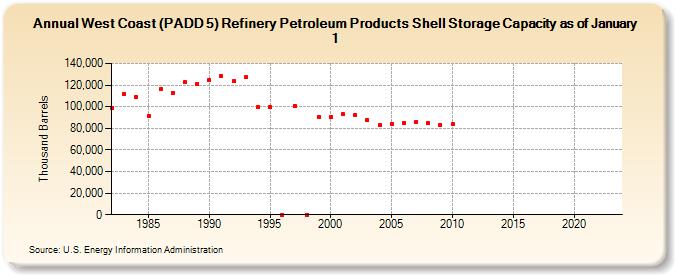
| West Coast (PADD 5) Refinery Petroleum Products Shell Storage Capacity as of January 1 (Thousand Barrels) | |||||
| Decade | Year-0 | Year-1 | Year-2 | Year-3 | Year-4 | Year-5 | Year-6 | Year-7 | Year-8 | Year-9 |
|---|---|---|---|---|---|---|---|---|---|---|
| 1980's | 98,403 | 111,703 | 108,947 | 91,397 | 116,016 | 113,063 | 122,586 | 121,434 | ||
| 1990's | 124,893 | 127,955 | 123,751 | 127,119 | 99,738 | 99,495 | 0 | 100,971 | 0 | 90,185 |
| 2000's | 90,346 | 92,944 | 92,569 | 87,640 | 82,867 | 84,162 | 85,250 | 86,219 | 84,867 | 83,387 |
| 2010's | 83,628 | -- | -- | -- | -- | -- | -- | -- | -- | -- |
| 2020's | -- | -- | -- | -- |
| - = No Data Reported; -- = Not Applicable; NA = Not Available; W = Withheld to avoid disclosure of individual company data. |
| Release Date: 6/21/2022 |
| Next Release Date: June 2024 |