|
Download Data (XLS File) |
|
|||||
|
|||||
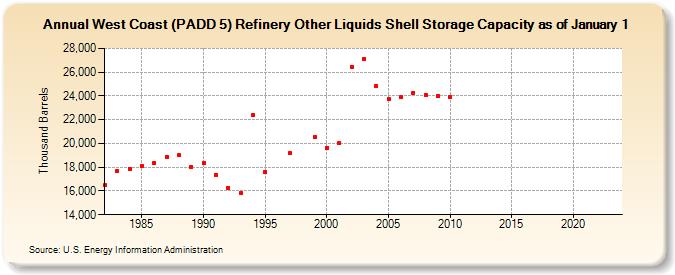
| West Coast (PADD 5) Refinery Other Liquids Shell Storage Capacity as of January 1 (Thousand Barrels) | |||||
| Decade | Year-0 | Year-1 | Year-2 | Year-3 | Year-4 | Year-5 | Year-6 | Year-7 | Year-8 | Year-9 |
|---|---|---|---|---|---|---|---|---|---|---|
| 1980's | 16,488 | 17,709 | 17,870 | 18,138 | 18,368 | 18,888 | 19,016 | 18,027 | ||
| 1990's | 18,336 | 17,358 | 16,265 | 15,862 | 22,399 | 17,600 | NA | 19,158 | NA | 20,528 |
| 2000's | 19,651 | 20,006 | 26,456 | 27,140 | 24,834 | 23,717 | 23,887 | 24,274 | 24,067 | 23,993 |
| 2010's | 23,924 | -- | -- | -- | -- | -- | -- | -- | -- | -- |
| 2020's | -- | -- | -- | -- | -- |
| - = No Data Reported; -- = Not Applicable; NA = Not Available; W = Withheld to avoid disclosure of individual company data. |
| Release Date: 6/14/2024 |
| Next Release Date: June 2025 |