|
Download Data (XLS File) |
|
|||||
|
|||||
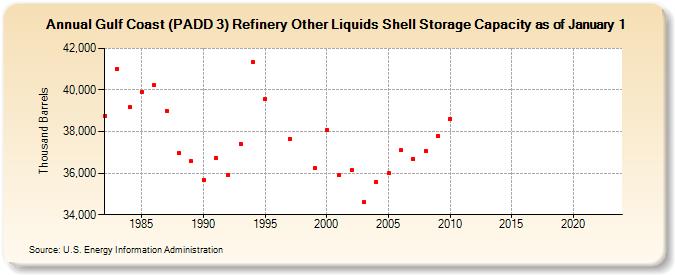
| Gulf Coast (PADD 3) Refinery Other Liquids Shell Storage Capacity as of January 1 (Thousand Barrels) | |||||
| Decade | Year-0 | Year-1 | Year-2 | Year-3 | Year-4 | Year-5 | Year-6 | Year-7 | Year-8 | Year-9 |
|---|---|---|---|---|---|---|---|---|---|---|
| 1980's | 38,767 | 41,018 | 39,174 | 39,906 | 40,218 | 39,001 | 36,972 | 36,568 | ||
| 1990's | 35,673 | 36,733 | 35,911 | 37,418 | 41,333 | 39,573 | NA | 37,658 | NA | 36,242 |
| 2000's | 38,098 | 35,889 | 36,156 | 34,592 | 35,575 | 35,989 | 37,093 | 36,692 | 37,054 | 37,793 |
| 2010's | 38,617 | -- | -- | -- | -- | -- | -- | -- | -- | -- |
| 2020's | -- | -- | -- | -- | -- |
| - = No Data Reported; -- = Not Applicable; NA = Not Available; W = Withheld to avoid disclosure of individual company data. |
| Release Date: 6/14/2024 |
| Next Release Date: June 2025 |