|
Download Data (XLS File) |
|
|||||
|
|||||
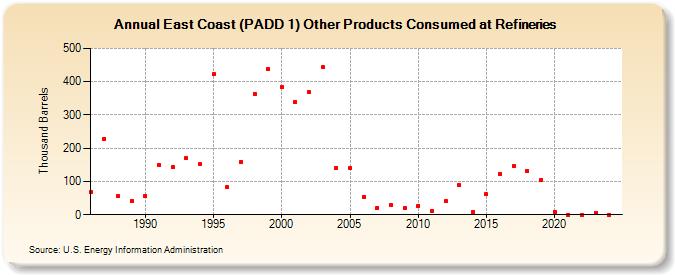
| East Coast (PADD 1) Other Products Consumed at Refineries (Thousand Barrels) | |||||
| Decade | Year-0 | Year-1 | Year-2 | Year-3 | Year-4 | Year-5 | Year-6 | Year-7 | Year-8 | Year-9 |
|---|---|---|---|---|---|---|---|---|---|---|
| 1980's | 67 | 229 | 55 | 42 | ||||||
| 1990's | 57 | 148 | 142 | 169 | 151 | 422 | 83 | 159 | 364 | 438 |
| 2000's | 384 | 340 | 368 | 444 | 141 | 141 | 54 | 21 | 29 | 20 |
| 2010's | 27 | 11 | 40 | 89 | 8 | 61 | 122 | 147 | 131 | 105 |
| 2020's | 9 | 0 | 0 |
| - = No Data Reported; -- = Not Applicable; NA = Not Available; W = Withheld to avoid disclosure of individual company data. |
| Release Date: 6/21/2022 |
| Next Release Date: June 2024 |
Referring Pages: