|
Download Data (XLS File) |
|
|||||
|
|||||
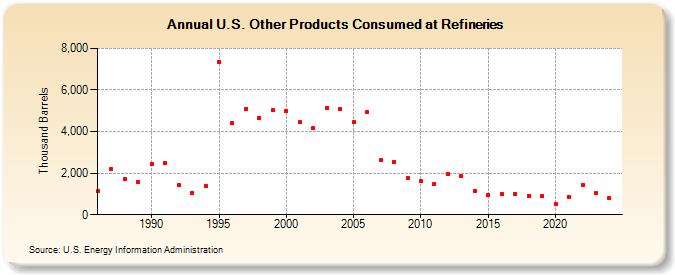
| U.S. Other Products Consumed at Refineries (Thousand Barrels) | |||||
| Decade | Year-0 | Year-1 | Year-2 | Year-3 | Year-4 | Year-5 | Year-6 | Year-7 | Year-8 | Year-9 |
|---|---|---|---|---|---|---|---|---|---|---|
| 1980's | 1,123 | 2,197 | 1,730 | 1,572 | ||||||
| 1990's | 2,433 | 2,498 | 1,438 | 1,064 | 1,391 | 7,346 | 4,395 | 5,086 | 4,666 | 5,033 |
| 2000's | 4,972 | 4,441 | 4,153 | 5,153 | 5,073 | 4,443 | 4,922 | 2,619 | 2,551 | 1,780 |
| 2010's | 1,600 | 1,495 | 1,972 | 1,848 | 1,153 | 951 | 1,004 | 994 | 924 | 894 |
| 2020's | 510 | 860 | 1,427 |
| - = No Data Reported; -- = Not Applicable; NA = Not Available; W = Withheld to avoid disclosure of individual company data. |
| Release Date: 6/21/2022 |
| Next Release Date: June 2024 |
Referring Pages: