|
Download Data (XLS File) |
|
|||||
|
|||||
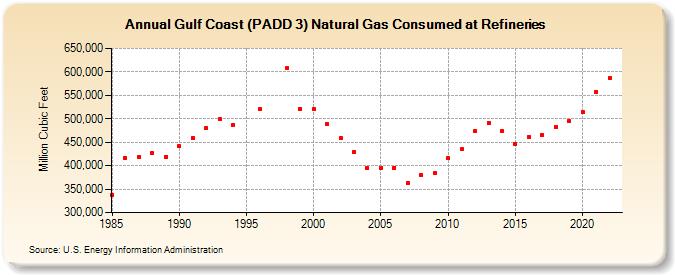
| Gulf Coast (PADD 3) Natural Gas Consumed at Refineries (Million Cubic Feet) | |||||
| Decade | Year-0 | Year-1 | Year-2 | Year-3 | Year-4 | Year-5 | Year-6 | Year-7 | Year-8 | Year-9 |
|---|---|---|---|---|---|---|---|---|---|---|
| 1980's | 338,022 | 416,319 | 419,198 | 426,877 | 419,156 | |||||
| 1990's | 441,868 | 459,835 | 480,550 | 499,028 | 487,115 | NA | 519,776 | NA | 607,868 | 521,537 |
| 2000's | 521,036 | 488,490 | 458,652 | 429,800 | 395,157 | 395,980 | 395,627 | 363,004 | 381,022 | 383,891 |
| 2010's | 415,660 | 434,493 | 474,359 | 491,023 | 474,212 | 445,865 | 462,107 | 465,489 | 482,945 | 495,521 |
| 2020's | 514,668 | 557,541 | 587,274 |
| - = No Data Reported; -- = Not Applicable; NA = Not Available; W = Withheld to avoid disclosure of individual company data. |
| Release Date: 6/21/2022 |
| Next Release Date: June 2024 |
Referring Pages: