|
Download Data (XLS File) |
|
||||||||
|
||||||||
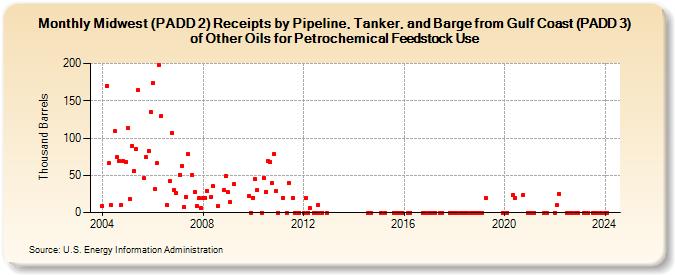
| Midwest (PADD 2) Receipts by Pipeline, Tanker, and Barge from Gulf Coast (PADD 3) of Other Oils for Petrochemical Feedstock Use (Thousand Barrels) | ||||||||
| Year | Jan | Feb | Mar | Apr | May | Jun | Jul | Aug | Sep | Oct | Nov | Dec |
|---|---|---|---|---|---|---|---|---|---|---|---|---|
| 2004 | 9 | 170 | 66 | 10 | 109 | 74 | 69 | 10 | 69 | 68 | ||
| 2005 | 113 | 18 | 89 | 56 | 85 | 164 | 46 | 74 | 83 | 135 | ||
| 2006 | 174 | 31 | 66 | 198 | 129 | 10 | 42 | 107 | 30 | 26 | ||
| 2007 | 51 | 63 | 7 | 21 | 78 | 51 | 28 | 9 | 19 | 6 | ||
| 2008 | 20 | 20 | 29 | 21 | 35 | 9 | 30 | 49 | ||||
| 2009 | 27 | 14 | 38 | 22 | 0 | |||||||
| 2010 | 20 | 45 | 30 | 0 | 47 | 28 | 69 | 68 | 39 | 79 | 29 | |
| 2011 | 0 | 20 | 0 | 40 | 20 | 0 | 0 | 0 | ||||
| 2012 | 0 | 20 | 0 | 6 | 0 | 0 | 10 | 0 | 0 | 0 | ||
| 2014 | 0 | 0 | ||||||||||
| 2015 | 0 | 0 | 0 | 0 | 0 | 0 | 0 | |||||
| 2016 | 0 | 0 | 0 | 0 | ||||||||
| 2017 | 0 | 0 | 0 | 0 | 0 | 0 | 0 | 0 | ||||
| 2018 | 0 | 0 | 0 | 0 | 0 | 0 | 0 | 0 | 0 | 0 | ||
| 2019 | 0 | 0 | 20 | 0 | ||||||||
| 2020 | 0 | 24 | 20 | 24 | 0 | |||||||
| 2021 | 0 | 0 | 0 | 0 | 0 | |||||||
| 2022 | 0 | 10 | 25 | 0 | 0 | 0 | 0 | 0 | ||||
| 2023 | 0 | 0 | 0 | 0 | 0 | 0 | 0 | |||||
| 2024 | 0 | 0 | ||||||||||
| - = No Data Reported; -- = Not Applicable; NA = Not Available; W = Withheld to avoid disclosure of individual company data. |
| Release Date: 5/31/2024 |
| Next Release Date: 6/28/2024 |