|
Download Data (XLS File) |
|
||||||||
|
||||||||
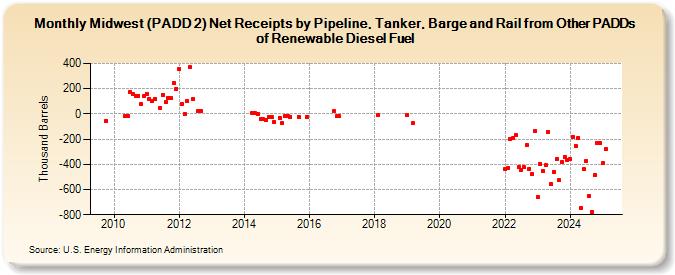
| Midwest (PADD 2) Net Receipts by Pipeline, Tanker, Barge and Rail from Other PADDs of Renewable Diesel Fuel (Thousand Barrels) | ||||||||
| Year | Jan | Feb | Mar | Apr | May | Jun | Jul | Aug | Sep | Oct | Nov | Dec |
|---|---|---|---|---|---|---|---|---|---|---|---|---|
| 2009 | -54 | |||||||||||
| 2010 | -20 | -16 | 175 | 159 | 143 | 144 | 76 | 139 | ||||
| 2011 | 160 | 118 | 102 | 122 | 49 | 152 | 94 | 127 | 123 | 247 | 201 | |
| 2012 | 355 | 79 | 0 | 100 | 371 | 120 | 23 | 23 | ||||
| 2014 | 5 | 5 | 3 | -40 | -43 | -46 | -24 | -23 | -62 | |||
| 2015 | -30 | -74 | -20 | -20 | -21 | -22 | -22 | |||||
| 2016 | 20 | -20 | -20 | |||||||||
| 2017 | -20 | -21 | ||||||||||
| 2018 | -10 | |||||||||||
| 2019 | -10 | -75 | ||||||||||
| 2022 | -434 | -429 | -201 | -195 | -171 | -424 | -442 | -423 | -247 | -436 | -476 | -132 |
| 2023 | -661 | -396 | -456 | -409 | -142 | -560 | -458 | -356 | -528 | -381 | -344 | -368 |
| 2024 | -362 | -184 | -254 | |||||||||
| - = No Data Reported; -- = Not Applicable; NA = Not Available; W = Withheld to avoid disclosure of individual company data. |
| Release Date: 5/31/2024 |
| Next Release Date: 6/28/2024 |