|
Download Data (XLS File) |
|
||||||||
|
||||||||
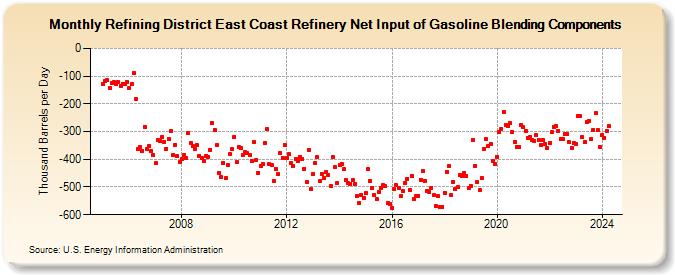
| Refining District East Coast Refinery Net Input of Gasoline Blending Components (Thousand Barrels per Day) | ||||||||
| Year | Jan | Feb | Mar | Apr | May | Jun | Jul | Aug | Sep | Oct | Nov | Dec |
|---|---|---|---|---|---|---|---|---|---|---|---|---|
| 2005 | -127 | -118 | -115 | -142 | -124 | -122 | -127 | -122 | -135 | -128 | -129 | -120 |
| 2006 | -143 | -130 | -88 | -181 | -364 | -357 | -369 | -282 | -363 | -353 | -370 | -384 |
| 2007 | -414 | -332 | -335 | -319 | -336 | -362 | -327 | -298 | -385 | -347 | -389 | -411 |
| 2008 | -400 | -383 | -395 | -304 | -341 | -351 | -363 | -350 | -388 | -395 | -405 | -387 |
| 2009 | -390 | -365 | -269 | -294 | -348 | -449 | -464 | -413 | -467 | -421 | -382 | -364 |
| 2010 | -319 | -411 | -354 | -361 | -383 | -375 | -378 | -383 | -405 | -337 | -402 | -448 |
| 2011 | -423 | -416 | -341 | -291 | -418 | -420 | -479 | -434 | -453 | -379 | -394 | -348 |
| 2012 | -394 | -382 | -413 | -424 | -398 | -407 | -390 | -399 | -434 | -483 | -366 | -509 |
| 2013 | -453 | -413 | -393 | -478 | -452 | -466 | -445 | -456 | -497 | -391 | -427 | -487 |
| 2014 | -420 | -417 | -436 | -474 | -487 | -488 | -474 | -489 | -531 | -558 | -529 | -538 |
| 2015 | -522 | -435 | -479 | -503 | -528 | -545 | -518 | -504 | -492 | -498 | -557 | -561 |
| 2016 | -577 | -508 | -494 | -505 | -532 | -516 | -485 | -470 | -510 | -461 | -542 | -531 |
| 2017 | -533 | -473 | -442 | -477 | -513 | -517 | -502 | -529 | -569 | -532 | -571 | -571 |
| 2018 | -521 | -445 | -425 | -528 | -482 | -509 | -501 | -457 | -460 | -448 | -459 | -504 |
| 2019 | -495 | -329 | -425 | -483 | -511 | -466 | -363 | -327 | -353 | -345 | -407 | -418 |
| 2020 | -390 | -301 | -290 | -229 | -277 | -281 | -270 | -302 | -338 | -354 | -355 | -277 |
| 2021 | -285 | -297 | -322 | -319 | -330 | -335 | -314 | -329 | -347 | -331 | -346 | -360 |
| 2022 | -341 | -303 | -282 | -280 | -297 | -328 | -326 | -310 | -309 | -339 | -359 | -340 |
| 2023 | -344 | -244 | -244 | -319 | -339 | -266 | -262 | -328 | -294 | -234 | -295 | -354 |
| 2024 | -313 | -322 | ||||||||||
| - = No Data Reported; -- = Not Applicable; NA = Not Available; W = Withheld to avoid disclosure of individual company data. |
| Release Date: 4/30/2024 |
| Next Release Date: 5/31/2024 |