|
Download Data (XLS File) |
|
||||||||
|
||||||||
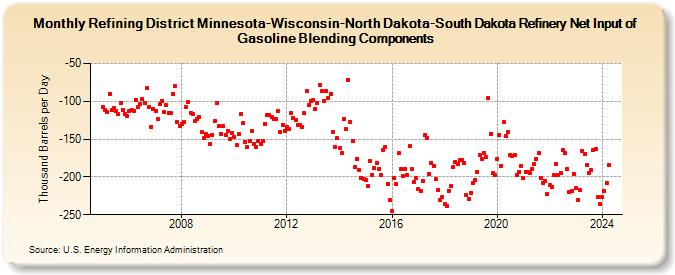
| Refining District Minnesota-Wisconsin-North Dakota-South Dakota Refinery Net Input of Gasoline Blending Components (Thousand Barrels per Day) | ||||||||
| Year | Jan | Feb | Mar | Apr | May | Jun | Jul | Aug | Sep | Oct | Nov | Dec |
|---|---|---|---|---|---|---|---|---|---|---|---|---|
| 2005 | -107 | -112 | -114 | -90 | -112 | -109 | -113 | -117 | -102 | -111 | -117 | -119 |
| 2006 | -113 | -111 | -113 | -98 | -108 | -103 | -97 | -102 | -83 | -107 | -134 | -110 |
| 2007 | -113 | -124 | -104 | -99 | -114 | -105 | -115 | -116 | -90 | -80 | -127 | -133 |
| 2008 | -130 | -127 | -107 | -101 | -115 | -117 | -126 | -123 | -121 | -141 | -149 | -143 |
| 2009 | -146 | -156 | -144 | -126 | -102 | -133 | -143 | -133 | -144 | -139 | -150 | -142 |
| 2010 | -147 | -158 | -143 | -117 | -129 | -154 | -160 | -153 | -139 | -156 | -161 | -152 |
| 2011 | -157 | -153 | -130 | -118 | -118 | -121 | -124 | -123 | -113 | -141 | -131 | -139 |
| 2012 | -134 | -137 | -116 | -122 | -125 | -132 | -132 | -134 | -116 | -86 | -105 | -100 |
| 2013 | -98 | -110 | -102 | -78 | -87 | -99 | -86 | -95 | -90 | -141 | -161 | -149 |
| 2014 | -162 | -168 | -124 | -137 | -72 | -127 | -153 | -187 | -176 | -191 | -201 | -203 |
| 2015 | -204 | -212 | -179 | -197 | -188 | -181 | -189 | -197 | -164 | -160 | -209 | -231 |
| 2016 | -245 | -202 | -210 | -169 | -189 | -199 | -189 | -198 | -159 | -190 | -207 | -202 |
| 2017 | -216 | -219 | -206 | -145 | -148 | -196 | -181 | -186 | -203 | -217 | -230 | -226 |
| 2018 | -236 | -238 | -218 | -212 | -187 | -180 | -183 | -178 | -177 | -182 | -224 | -229 |
| 2019 | -221 | -208 | -204 | -193 | -171 | -176 | -168 | -174 | -95 | -143 | -195 | -198 |
| 2020 | -176 | -145 | -185 | -128 | -146 | -141 | -171 | -173 | -171 | -197 | -193 | -185 |
| 2021 | -202 | -193 | -193 | -195 | -189 | -183 | -176 | -169 | -201 | -208 | -206 | -223 |
| 2022 | -211 | -213 | -198 | -183 | -197 | -195 | -165 | -169 | -189 | -220 | -219 | -196 |
| 2023 | -215 | -230 | -217 | -166 | -170 | -184 | -195 | -191 | -164 | -163 | -227 | -236 |
| 2024 | -227 | -219 | ||||||||||
| - = No Data Reported; -- = Not Applicable; NA = Not Available; W = Withheld to avoid disclosure of individual company data. |
| Release Date: 4/30/2024 |
| Next Release Date: 5/31/2024 |