|
Download Data (XLS File) |
|
||||||||
|
||||||||
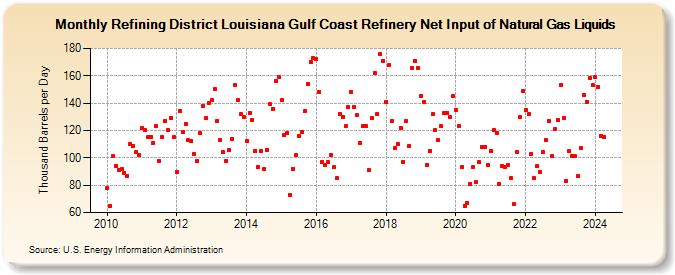
| Refining District Louisiana Gulf Coast Refinery Net Input of Natural Gas Liquids (Thousand Barrels per Day) | ||||||||
| Year | Jan | Feb | Mar | Apr | May | Jun | Jul | Aug | Sep | Oct | Nov | Dec |
|---|---|---|---|---|---|---|---|---|---|---|---|---|
| 2010 | 78 | 65 | 101 | 94 | 91 | 92 | 89 | 87 | 110 | 109 | 104 | 102 |
| 2011 | 122 | 120 | 115 | 115 | 111 | 123 | 98 | 115 | 127 | 120 | 129 | 115 |
| 2012 | 90 | 134 | 119 | 125 | 113 | 112 | 103 | 98 | 118 | 138 | 129 | 140 |
| 2013 | 142 | 150 | 127 | 113 | 104 | 98 | 106 | 114 | 153 | 142 | 132 | 130 |
| 2014 | 112 | 133 | 128 | 105 | 93 | 105 | 92 | 106 | 139 | 136 | 156 | 159 |
| 2015 | 142 | 117 | 118 | 73 | 92 | 102 | 116 | 119 | 134 | 154 | 170 | 173 |
| 2016 | 172 | 148 | 97 | 95 | 97 | 102 | 93 | 85 | 132 | 130 | 123 | 137 |
| 2017 | 148 | 137 | 131 | 111 | 123 | 123 | 91 | 129 | 162 | 132 | 176 | 171 |
| 2018 | 141 | 168 | 127 | 107 | 110 | 122 | 97 | 127 | 109 | 166 | 171 | 166 |
| 2019 | 145 | 141 | 95 | 105 | 132 | 120 | 113 | 123 | 133 | 133 | 130 | 145 |
| 2020 | 135 | 123 | 93 | 65 | 67 | 81 | 93 | 82 | 97 | 108 | 108 | 95 |
| 2021 | 105 | 120 | 118 | 81 | 94 | 93 | 95 | 85 | 66 | 104 | 130 | 149 |
| 2022 | 135 | 132 | 103 | 85 | 94 | 90 | 104 | 113 | 127 | 101 | 121 | 128 |
| 2023 | 153 | 129 | 83 | 105 | 101 | 101 | 87 | 107 | 146 | 141 | 158 | 153 |
| 2024 | 159 | 152 | 116 | 115 | 102 | 100 | 107 | 110 | ||||
| - = No Data Reported; -- = Not Applicable; NA = Not Available; W = Withheld to avoid disclosure of individual company data. |
| Release Date: 10/31/2024 |
| Next Release Date: 11/29/2024 |