|
Download Data (XLS File) |
|
||||||||
|
||||||||
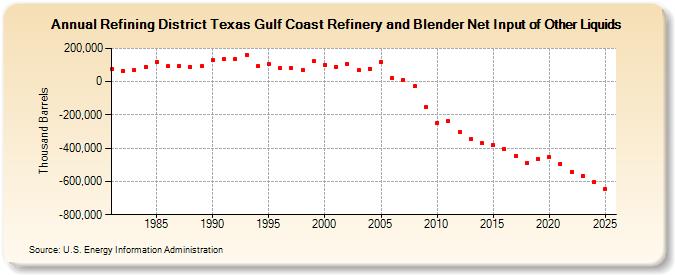
| Refining District Texas Gulf Coast Refinery and Blender Net Input of Other Liquids (Thousand Barrels) | ||||||||
| Decade | Year-0 | Year-1 | Year-2 | Year-3 | Year-4 | Year-5 | Year-6 | Year-7 | Year-8 | Year-9 |
|---|---|---|---|---|---|---|---|---|---|---|
| 1980's | 77,895 | 64,495 | 68,886 | 88,179 | 116,803 | 93,788 | 96,614 | 88,457 | 92,196 | |
| 1990's | 130,175 | 133,274 | 137,099 | 162,907 | 91,219 | 104,797 | 81,791 | 84,032 | 71,476 | 121,782 |
| 2000's | 102,338 | 90,377 | 107,058 | 67,171 | 78,309 | 120,725 | 20,995 | 11,408 | -28,493 | -152,504 |
| 2010's | -249,839 | -236,844 | -304,680 | -343,609 | -371,241 | -382,006 | -406,276 | -448,216 | -488,037 | -463,277 |
| 2020's | -454,506 | -492,275 | -543,576 | -561,872 |
| - = No Data Reported; -- = Not Applicable; NA = Not Available; W = Withheld to avoid disclosure of individual company data. |
| Release Date: 5/31/2024 |
| Next Release Date: 8/30/2024 |