|
Download Data (XLS File) |
|
||||||||
|
||||||||
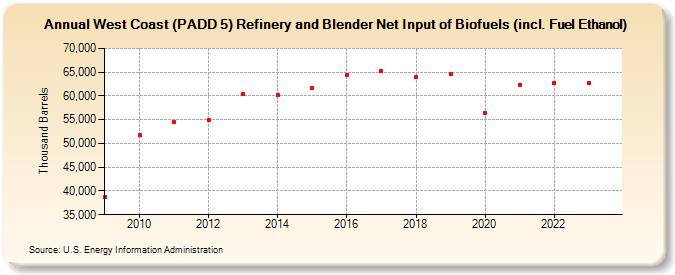
| West Coast (PADD 5) Refinery and Blender Net Input of Biofuels (incl. Fuel Ethanol) (Thousand Barrels) | ||||||||
| Decade | Year-0 | Year-1 | Year-2 | Year-3 | Year-4 | Year-5 | Year-6 | Year-7 | Year-8 | Year-9 |
|---|---|---|---|---|---|---|---|---|---|---|
| 2000's | 38,754 | |||||||||
| 2010's | 51,768 | 54,447 | 54,867 | 60,368 | 60,122 | 61,643 | 64,497 | 65,167 | 64,002 | 64,507 |
| 2020's | 56,360 | 62,276 | 62,734 | 62,738 |
| - = No Data Reported; -- = Not Applicable; NA = Not Available; W = Withheld to avoid disclosure of individual company data. |
| Release Date: 5/31/2024 |
| Next Release Date: 8/30/2024 |