|
Download Data (XLS File) |
|
||||||||
|
||||||||
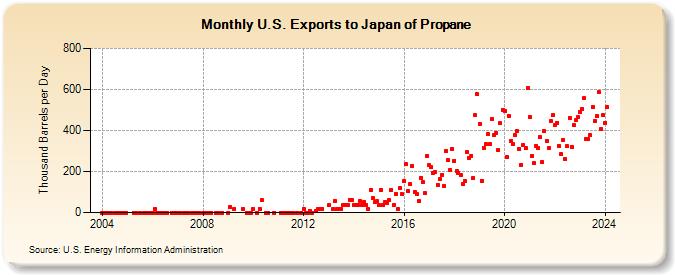
| U.S. Exports to Japan of Propane (Thousand Barrels per Day) | ||||||||
| Year | Jan | Feb | Mar | Apr | May | Jun | Jul | Aug | Sep | Oct | Nov | Dec |
|---|---|---|---|---|---|---|---|---|---|---|---|---|
| 2004 | 0 | 0 | 0 | 0 | 0 | 0 | 0 | 0 | 0 | 0 | 0 | |
| 2005 | 0 | 0 | 0 | 0 | 0 | 0 | 0 | |||||
| 2006 | 0 | 18 | 0 | 0 | 0 | 0 | 0 | 0 | 0 | 0 | 0 | |
| 2007 | 0 | 0 | 0 | 0 | 0 | 0 | 0 | 0 | 0 | |||
| 2008 | 0 | 0 | 0 | 0 | 0 | 0 | 0 | 0 | ||||
| 2009 | 0 | 26 | 18 | 18 | 0 | 0 | 0 | |||||
| 2010 | 17 | 0 | 18 | 62 | 0 | 0 | 0 | |||||
| 2011 | 0 | 0 | 0 | 0 | 0 | 0 | 0 | 0 | 0 | |||
| 2012 | 18 | 0 | 0 | 9 | 0 | 8 | 18 | 18 | 18 | |||
| 2013 | 35 | 17 | 57 | 17 | 19 | 19 | 35 | 38 | 37 | 63 | 63 | |
| 2014 | 36 | 39 | 37 | 57 | 37 | 51 | 37 | 17 | 110 | 73 | 51 | 54 |
| 2015 | 37 | 111 | 37 | 53 | 49 | 59 | 110 | 36 | 90 | 17 | 119 | 90 |
| 2016 | 153 | 235 | 105 | 138 | 226 | 99 | 92 | 55 | 169 | 148 | 93 | 276 |
| 2017 | 230 | 222 | 193 | 196 | 136 | 164 | 184 | 129 | 299 | 254 | 208 | 312 |
| 2018 | 253 | 203 | 193 | 183 | 141 | 153 | 294 | 268 | 277 | 168 | 474 | 576 |
| 2019 | 432 | 156 | 316 | 334 | 381 | 333 | 455 | 378 | 390 | 305 | 435 | 502 |
| 2020 | 496 | 273 | 472 | 351 | 333 | 377 | 397 | 309 | 233 | 330 | 313 | 605 |
| 2021 | 465 | 276 | 241 | 326 | 316 | 367 | 247 | 396 | 350 | 317 | 446 | 474 |
| 2022 | 427 | 438 | 325 | 284 | 354 | 260 | 323 | 462 | 319 | 426 | 450 | 464 |
| 2023 | 491 | 505 | 558 | 359 | 358 | 376 | 514 | 447 | 472 | 586 | 408 | 474 |
| 2024 | 438 | |||||||||||
| - = No Data Reported; -- = Not Applicable; NA = Not Available; W = Withheld to avoid disclosure of individual company data. |
| Release Date: 3/29/2024 |
| Next Release Date: 4/30/2024 |