|
Download Data (XLS File) |
|
|||||
|
|||||
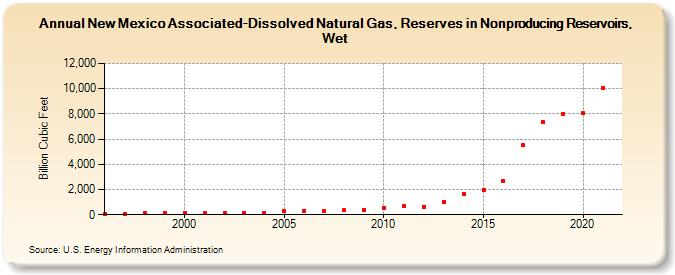
| New Mexico Associated-Dissolved Natural Gas, Reserves in Nonproducing Reservoirs, Wet (Billion Cubic Feet) | |||||
| Decade | Year-0 | Year-1 | Year-2 | Year-3 | Year-4 | Year-5 | Year-6 | Year-7 | Year-8 | Year-9 |
|---|---|---|---|---|---|---|---|---|---|---|
| 1990's | 74 | 66 | 109 | 122 | ||||||
| 2000's | 125 | 126 | 132 | 140 | 160 | 272 | 322 | 294 | 337 | 408 |
| 2010's | 557 | 662 | 650 | 1,029 | 1,653 | 1,949 | 2,638 | 5,521 | 7,327 | 8,020 |
| 2020's | 8,047 | 10,026 |
| - = No Data Reported; -- = Not Applicable; NA = Not Available; W = Withheld to avoid disclosure of individual company data. |
| Release Date: 12/30/2022 |
| Next Release Date: NA |