|
Download Data (XLS File) |
|
|||||
|
|||||
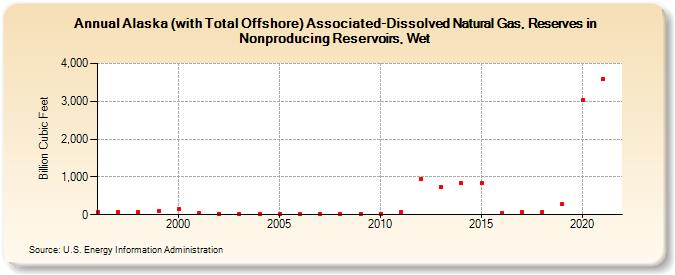
| Alaska (with Total Offshore) Associated-Dissolved Natural Gas, Reserves in Nonproducing Reservoirs, Wet (Billion Cubic Feet) | |||||
| Decade | Year-0 | Year-1 | Year-2 | Year-3 | Year-4 | Year-5 | Year-6 | Year-7 | Year-8 | Year-9 |
|---|---|---|---|---|---|---|---|---|---|---|
| 1990's | 61 | 82 | 70 | 97 | ||||||
| 2000's | 147 | 37 | 29 | 25 | 17 | 14 | 7 | 21 | 27 | 20 |
| 2010's | 15 | 63 | 954 | 740 | 834 | 829 | 53 | 79 | 85 | 290 |
| 2020's | 3,022 | 3,584 |
| - = No Data Reported; -- = Not Applicable; NA = Not Available; W = Withheld to avoid disclosure of individual company data. |
| Release Date: 12/30/2022 |
| Next Release Date: NA |